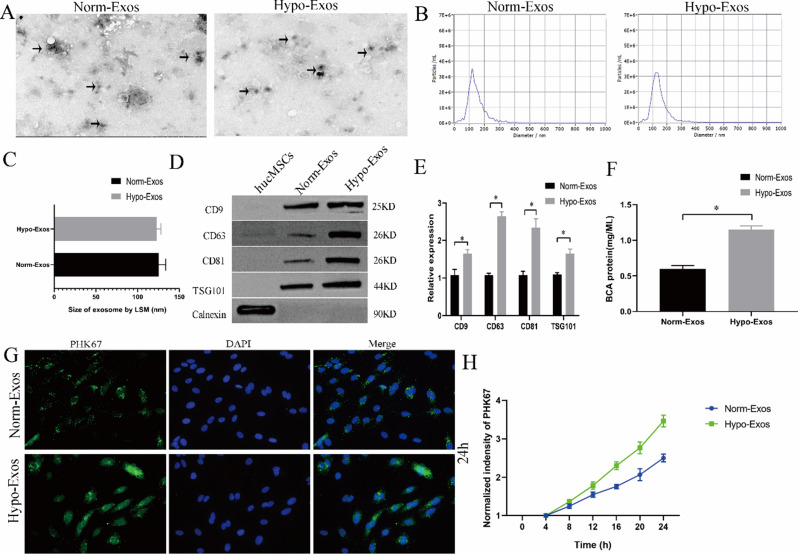
Fig. 2.
Characterization and internalization of norm-Exos and hypo-Exos. A. Morphology of norm-Exos and hypo-Exos observed using TEM. B. Particle size distributions were determined by NTA. C. Comparison of the mean diameters of norm-Exos and hypo-Exos. D. The exosomal surface markers (TSG101, CD9, CD63, and CD81) in norm-Exos and hypo-Exos were assessed by western blotting. E. Semiquantitative analysis of the protein levels of TSG101, CD9, CD63, and CD81. F. Exosomal protein concentrations in norm-Exos and hypo-Exos were analysed using the BCA assay. G. Uptake of PKH67-labelled norm-Exos and hypo-Exos into ROMECs at 24 h. H. Statistical evaluation of fluorescence intensities in the norm-Exo and hypo-Exo groups. n = 3 per group, *P < 0.05 for all figures

