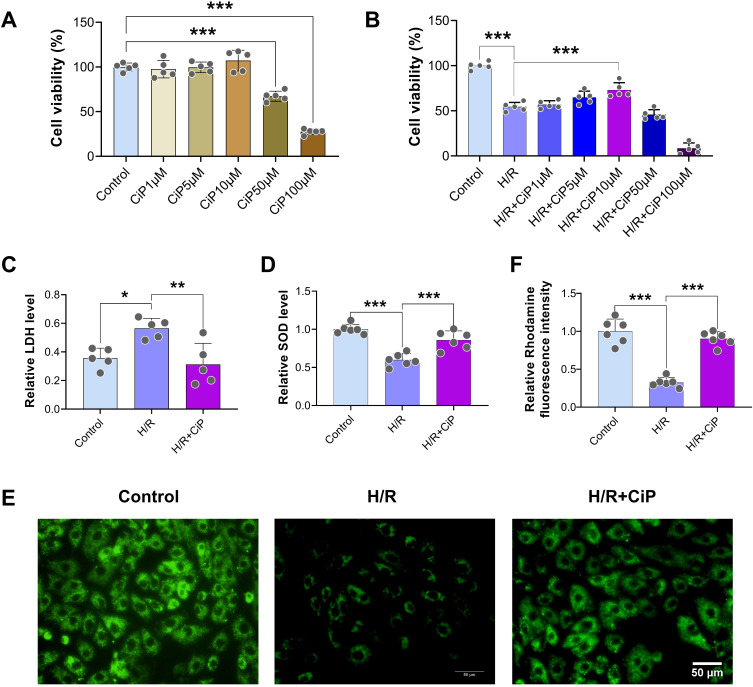
Figure 2.
Ciprofol attenuated H/R-induced injury in H9c2 cardiomyocytes. (A) Cell viability after ciprofol (1, 5, 10, 50, and 100 μM) in the normal condition. (B) Cell viability after ciprofol (1, 5, 10, 50, and 100 μM) during H/R. (C and D) Levels of LDH and SOD. Ciprofol (10 μM) was added 1 h before H/R. (E and F) Representative images and fluorescence intensity of Rhodamine 123 staining. Ciprofol (10 μM) was added 1 h before H/R. Scale bar = 50 µm. Data are shown as mean ± SD (n = 5‒6). *P < 0.05, **P < 0.01, ***P < 0.001.

