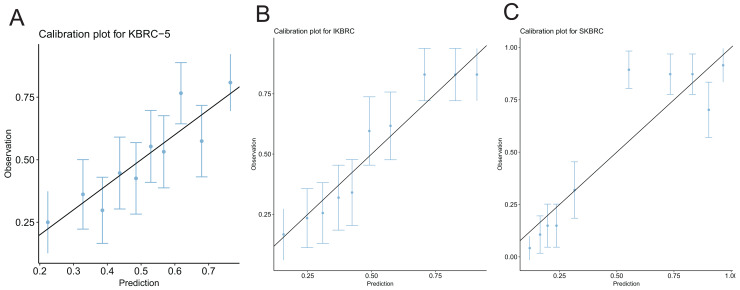
Figure 3. Calibration plots of the KBRC-5 model, IKBRC model, and SKBRC model.
(A) This calibration plot evaluates the agreement between predicted probabilities and observed outcomes for bleeding complications following percutaneous renal biopsy using the KBRC-5 model. (B) This calibration plot evaluates the agreement between predicted probabilities and observed outcomes for bleeding complications following percutaneous renal biopsy using the IKBRC model. (C) This calibration plot evaluates the agreement between predicted probabilities and observed outcomes for bleeding complications following percutaneous renal biopsy using the SKBRC model. The solid diagonal line represents perfect calibration, where predicted probabilities perfectly match the observed probabilities. The blue dots represent the observed frequencies of bleeding events within deciles of predicted probabilities, while the vertical error bars indicate the 95% confidence intervals for the observed frequencies.

