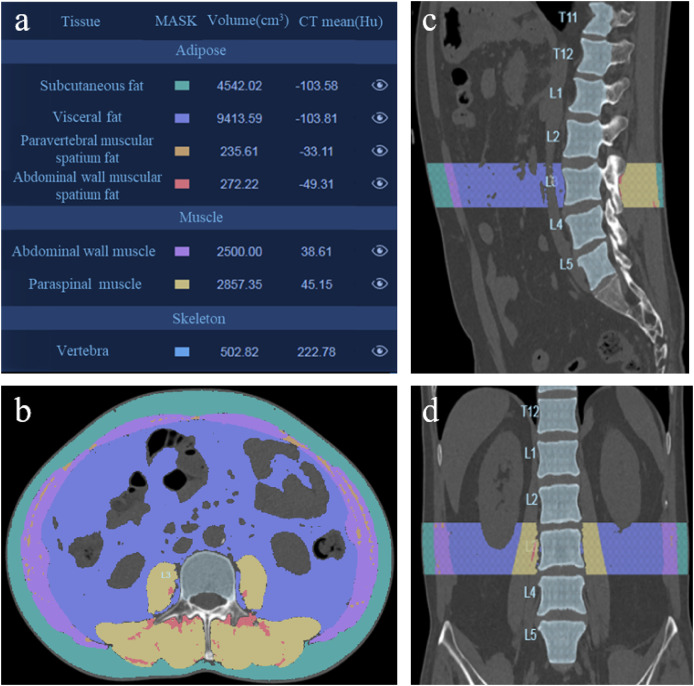
Figure 1. 3D CT reconstruction to analyze the L3 adipose and muscle tissue.
(A) Analysis results of patient’s adipose and muscle tissue. (B) Axial slice reformation of a preoperative CT scan at the L3 level. (C) Sagittal reformation at the L3 level of the same patient. (D) Coronal plane reformation at the L3 level of the same patient.

