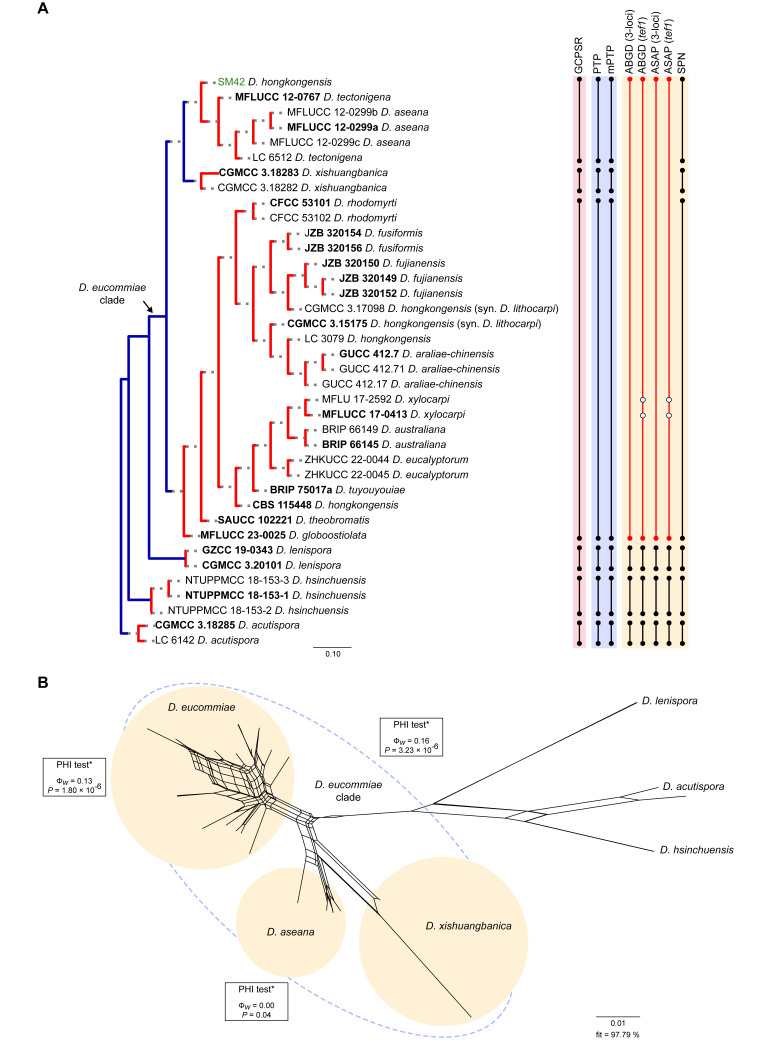
Fig. 14.
Species delimitation analyses of the Diaporthe eucommiae clade. A. Comparison of species delimitation results for the D. eucommiae clade based on a combined dataset of 5-loci (ITS, tef1, tub2, cal and his3), unless indicated otherwise (see Materials and Methods for further explanation). Schematic phylogenetic relationships are shown using the species delimitation scheme obtained from the PTP analysis, in which putative species clusters are represented as transitions from blue-coloured (speciation process) to red-coloured (population process) branches. Dot-bounded bars in the right-hand columns show the results of the genealogical concordance- (pink column; GCPSR), coalescent- (blue column; PTP and mPTP) and distance-based (yellow column; ABGD, ASAP and SPN) species delimitation analyses, which are referred to at the top. Incongruent results in relation to the GCPSR are highlighted in red. Empty dots indicate taxa excluded from the analysis due to lack of sequence data. B, C. NeighborNet phylogenetic networks of D. eucommiae and related species based on the LogDet transformation for a combined dataset of 5-loci (ITS, tef1, tub2, cal and his3). The D. eucommiae clade and respective species are delimited by dashed and coloured shapes, respectively. The PHI test results are presented next to each set of species tested and if positive for recombination is indicated by an asterisk (*). Strains with type status are indicated in bold font. The isolate from palm tissues included in the analyses is presented in green typeface. The scale bars represent the expected number of nucleotide changes per site.

