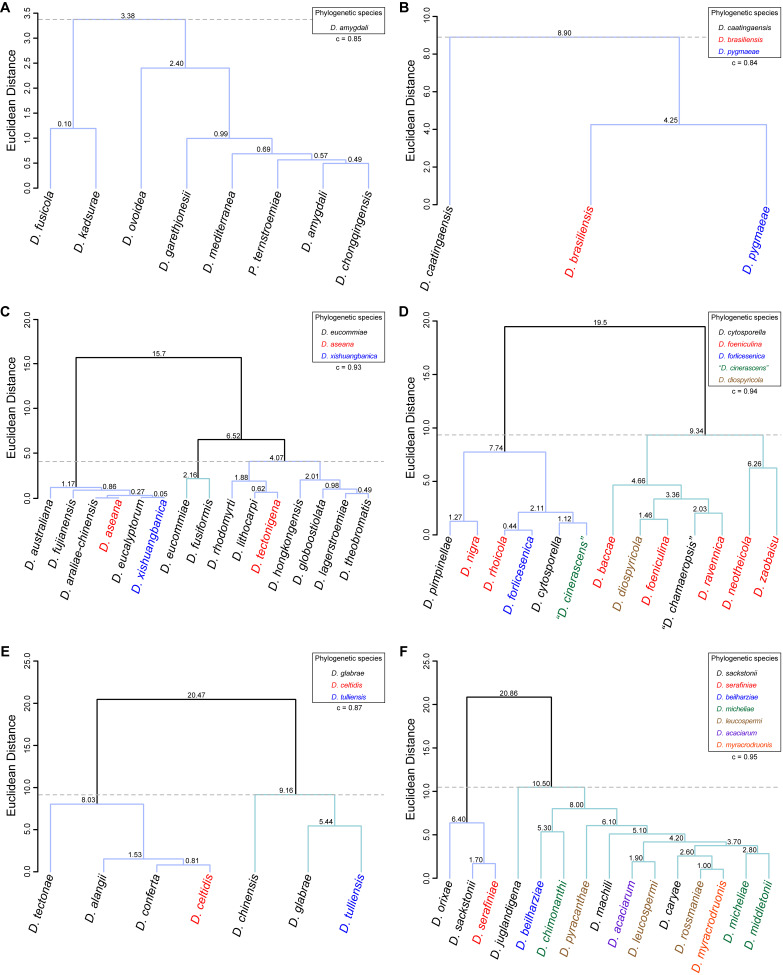
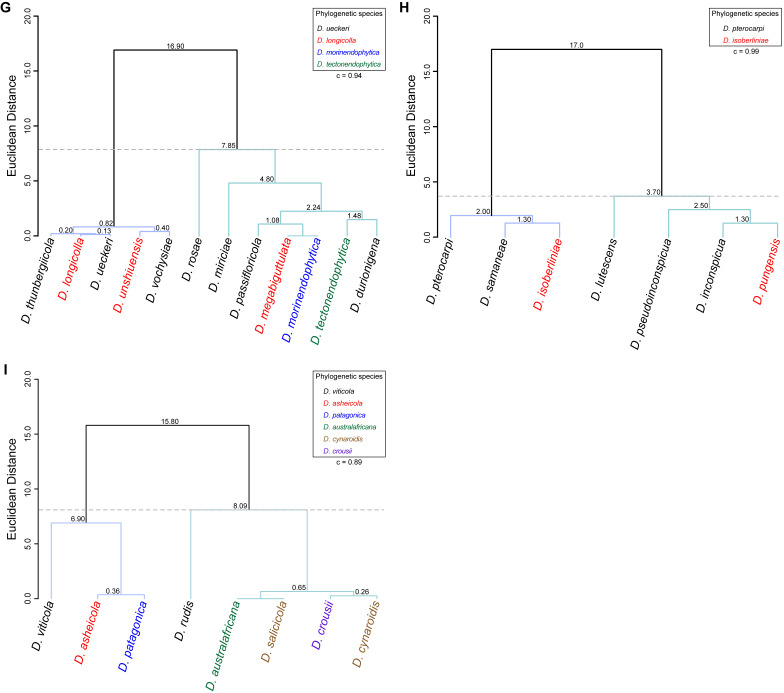
Fig. 21.
Dendrograms obtained by hierarchical cluster analysis of Diaporthe clades using Euclidean distance and UPGMA algorithm. A. Dendrogram of the D. amygdali clade based on the length-to-width ratio (L/W) of alpha conidia and elements of the conidiogenous layer. B. Dendrogram of the D. brasiliensis clade based on the L/W of alpha conidia and elements of the conidiogenous layer. C. Dendrogram of the D. eucommiae clade based on the L/W of alpha and beta conidia. D. Dendrogram of the D. foeniculina clade based on the L/W of alpha and beta conidia and elements of the conidiogenous layer. E. Dendrogram of the D. glabrae clade based on the L/W of alpha and beta conidia and elements of the conidiogenous layer. F. Dendrogram of the D. inconspicua clade based on the L/W of alpha and beta conidia and elements of the conidiogenous layer. G. Dendrogram of the D. leucospermi clade based on the L/W of alpha and beta conidia and elements of the conidiogenous layer. H. Dendrogram of the D. longicolla clade based on the L/W of alpha and beta conidia. I. Dendrogram of the D. rudis clade based on the L/W of alpha and beta conidia and elements of the conidiogenous layer. The taxa included in each analysis were those with available measurements for the micromorphological structure used to infer the respective dendrogram. The horizontal dashed lines indicate the putative distance cut-of level used to produce clusters. Euclidean distance values greater than 0.00 are shown at the nodes. Clusters are highlighted with coloured lines. Phylogenetic species are highlighted by different coloured typefaces and referred to in the chart legend. The cophenetic correlation coefficient (c) is noted below the chart legend.


