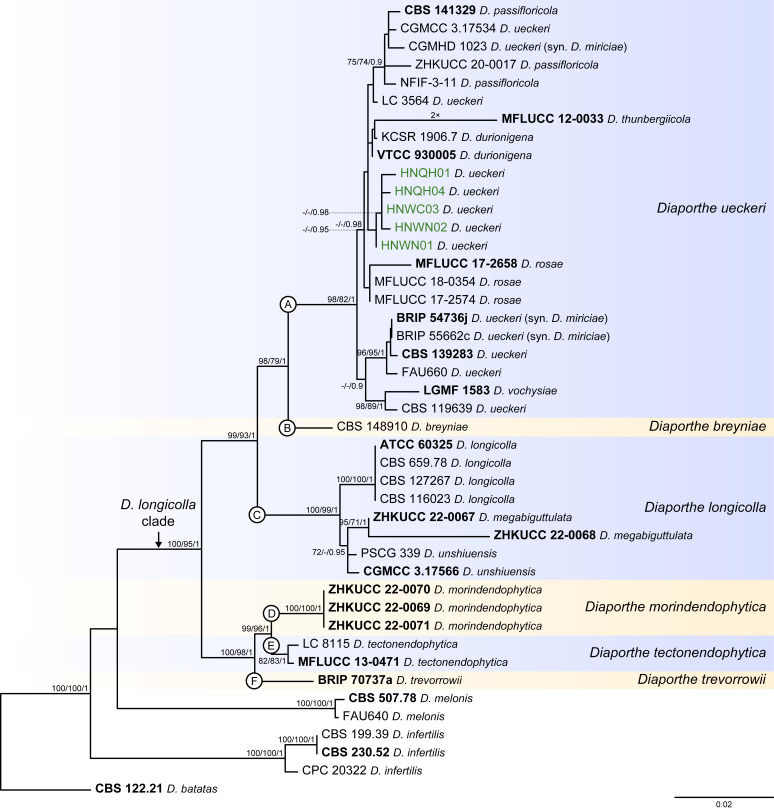
Fig. 9.
Phylogenetic tree generated from a maximum likelihood analysis based on combined ITS, tef1, tub2, cal and his3 sequence data of the Diaporthe longicolla clade and closely related species. Bootstrap support values for maximum likelihood, maximum parsimony (ML-BS/MP-BS ≥ 70 %) and Bayesian posterior probabilities (PP ≥ 0.90) are shown at the nodes. Strains with type status are indicated in bold font. The isolates from palm tissues included in the analyses are presented in green typeface. Species boundaries within the D. longicolla clade are delimited with coloured blocks and their respective branches are indicated by lettered circles (A–F). The scale bar represents the expected number of nucleotide changes per site. The tree is rooted to D. batatas (CBS 122.21).

