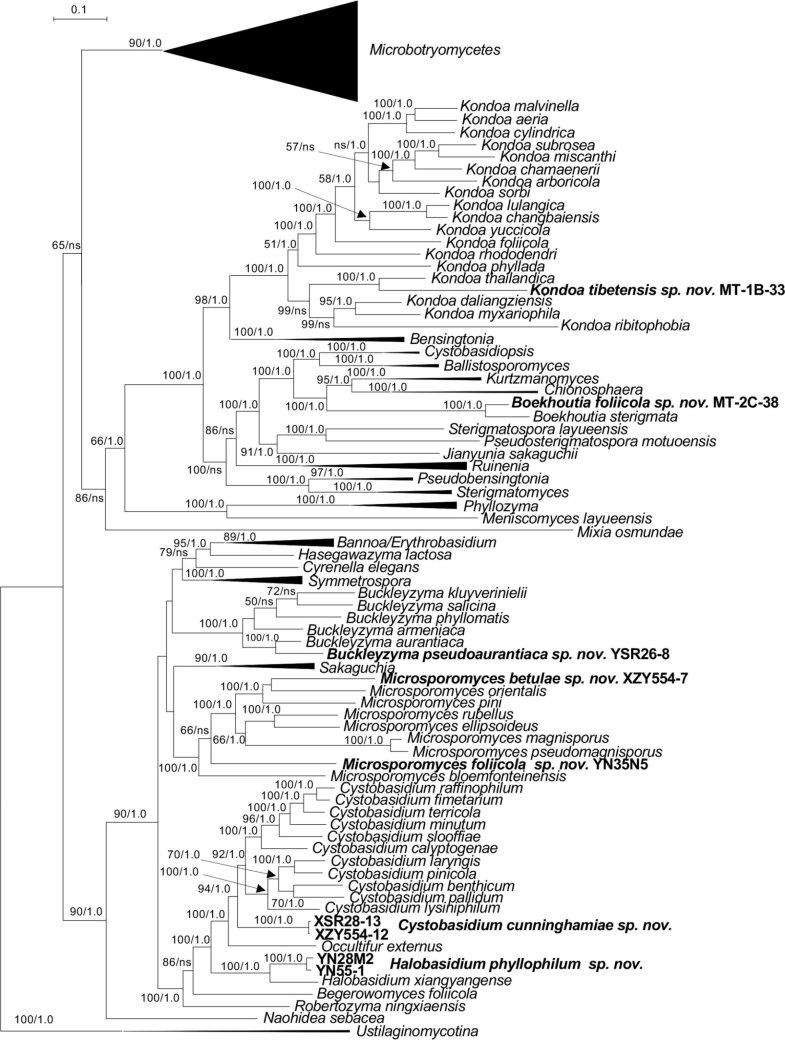
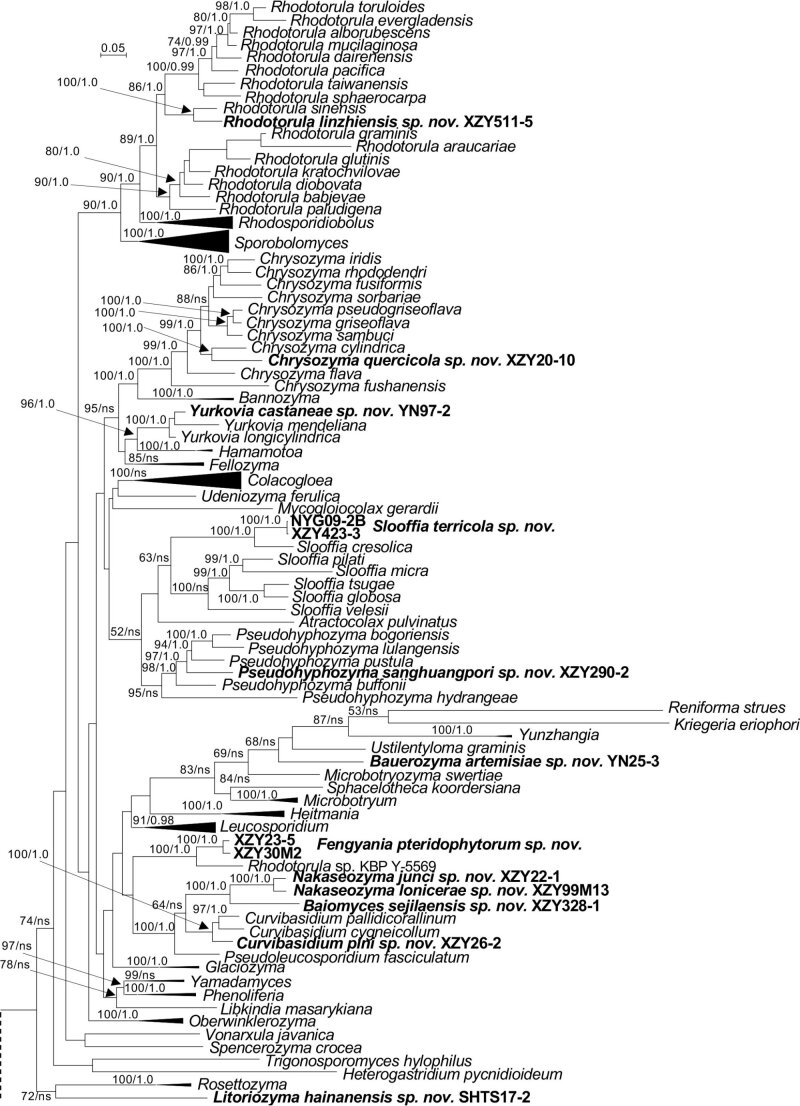
Fig. 3.
Phylogenetic tree inferred using the combined sequences of SSU rDNA, ITS (including 5.8S rDNA), LSU rDNA D1/D2 domains, RPB1, RPB2 and TEF1, depicting the phylogenetic positions of new taxa (in bold) within Pucciniomycotina. The tree backbone was constructed using maximum likelihood analysis. Bootstrap percentages of maximum likelihood analysis over 50 % from 1 000 bootstrap replicates and posterior probabilities of Bayesian inference above 0.9 are shown respectively from left to right on the deep and major branches. Scale bar represents 0.1 substitutions per nucleotide position. Note: ns, not supported (BP < 50 % or PP < 0.9).


