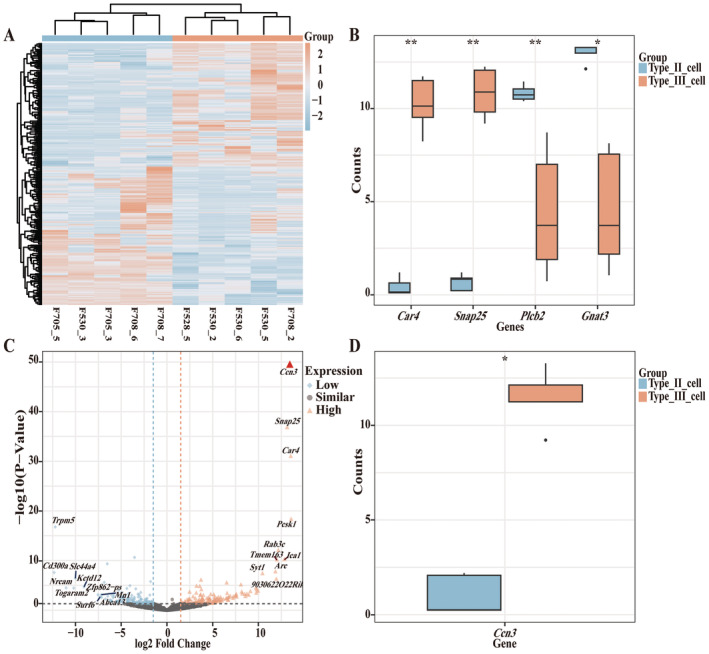
FIGURE 1.

In scRNA‐seq analysis of FuP, Ccn3 is highly expressed in type III taste cells. (A) Heatmap of DEGs. The normalized gene expression values were rescaled from −2 to 2. (B) Box plot showing the expression distribution of taste cell marker genes in type II cells and type III cells, respectively. Statistical differences were analyzed by the Wilcoxon rank sum test in R software. (C) Volcano plot of the genes. Orange triangles represent significantly high‐expressed genes (high), with red triangles indicating the highest one in Type III cells compared to Type II cells. Blue diamonds represent significantly low‐expressed genes (low), and black circles represent genes with no significant change (similar), considering genes with an absolute fold change ≥ 1.5 and a p‐value < 0.05 as significant. (D) Box plot showing the expression level of Ccn3 in type II cells and type III cells, respectively. In the boxplot, the central line indicates the median, while the boxes represent the interquartile range (IQR) from the first quartile (Q1) to the third quartile (Q3). The whiskers extend to the minimum and maximum values within 1.5 times the IQR, and outliers are shown as points beyond the whiskers. Statistical differences were analyzed by the Wilcoxon rank sum test in R software. *p < 0.05; **p < 0.01.
