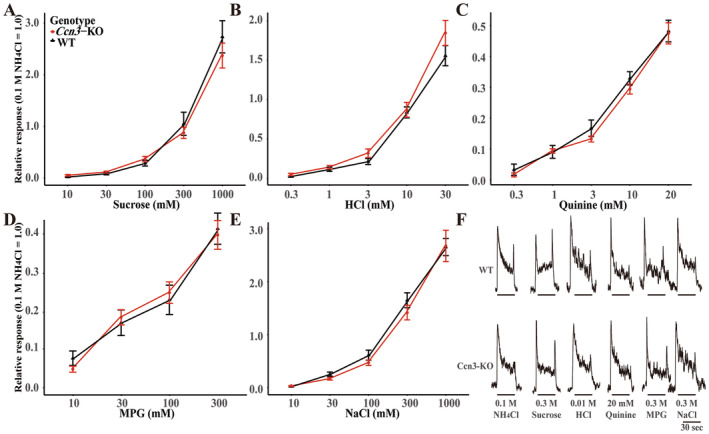
FIGURE 5.

The deletion of Ccn3 had no impact on gustatory nerve responses. The concentration–response relationships of CT nerve responses of WT (black triangles) and Ccn3‐KO mice (red circles) for sucrose (A), HCl (B), quinine (C), MPG (D), and NaCl (E) (WT: n = 7, Ccn3‐KO: n = 7). (F) Sample recordings of integrated whole nerve responses from the CT nerve of a WT (upper trace) and Ccn3‐KO mouse (lower trace). The bars represent the duration of taste stimulus application. Gustatory nerve responses were normalized to the response to 100 mM NH4Cl. Values are presented means ± SEM. Statistical differences were analyzed by two‐way ANOVA tests (Table S6). WT mice (n = 12) and Ccn3‐KO mice (n = 15).
