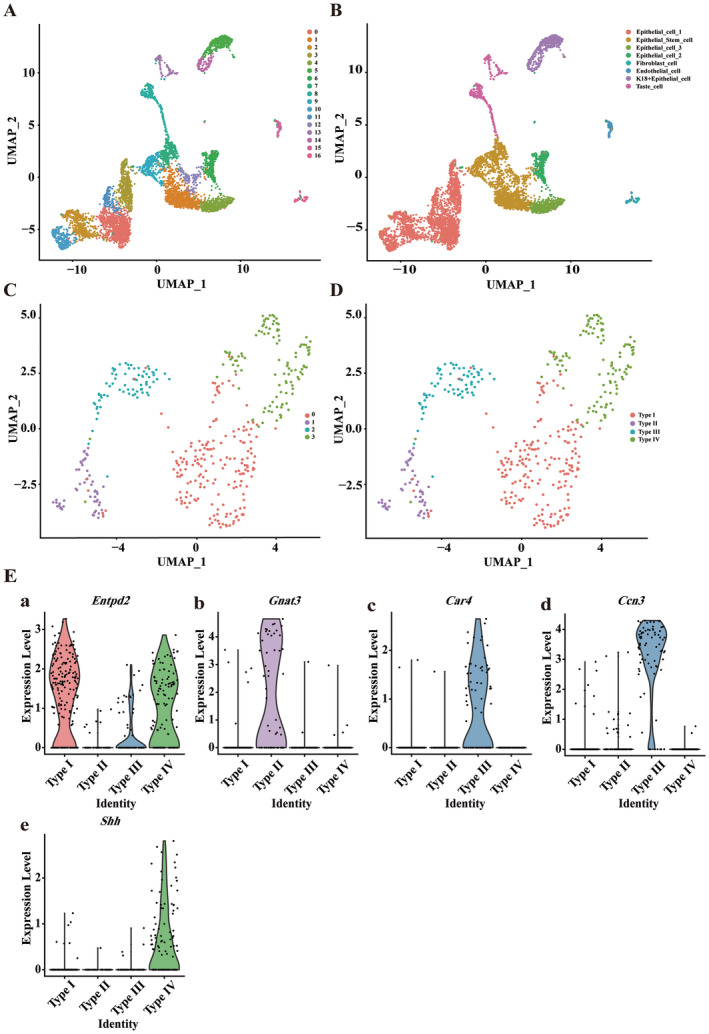
FIGURE 7.

Single‐cell transcriptomics landscape of epithelial cells from the circumvallate and the foliate papillae. (A) Illustration of the single‐cell transcriptomic profiles, showing the diversity and distribution of cell clusters. (B) Following manual annotation, eight distinct cell populations were identified: Epithelial_cell_1, Epithelial_cell_2, Epithelial_cell_3, Epithelial_stem_cell, Fibroblast_cell, Endothelial_cell, K18+Epithelial_cell, and Taste_cell. (C) Single‐cell transcriptomic profiles of taste cells. (D) After manual annotation, four distinct cell clusters were identified: Type I, Type II, Type III, and Type IV. (E) Expression levels of Ccn3 and marker genes for each taste cell type across different clusters. Row data from Vercauteren Drubbel and Beck (2023).
