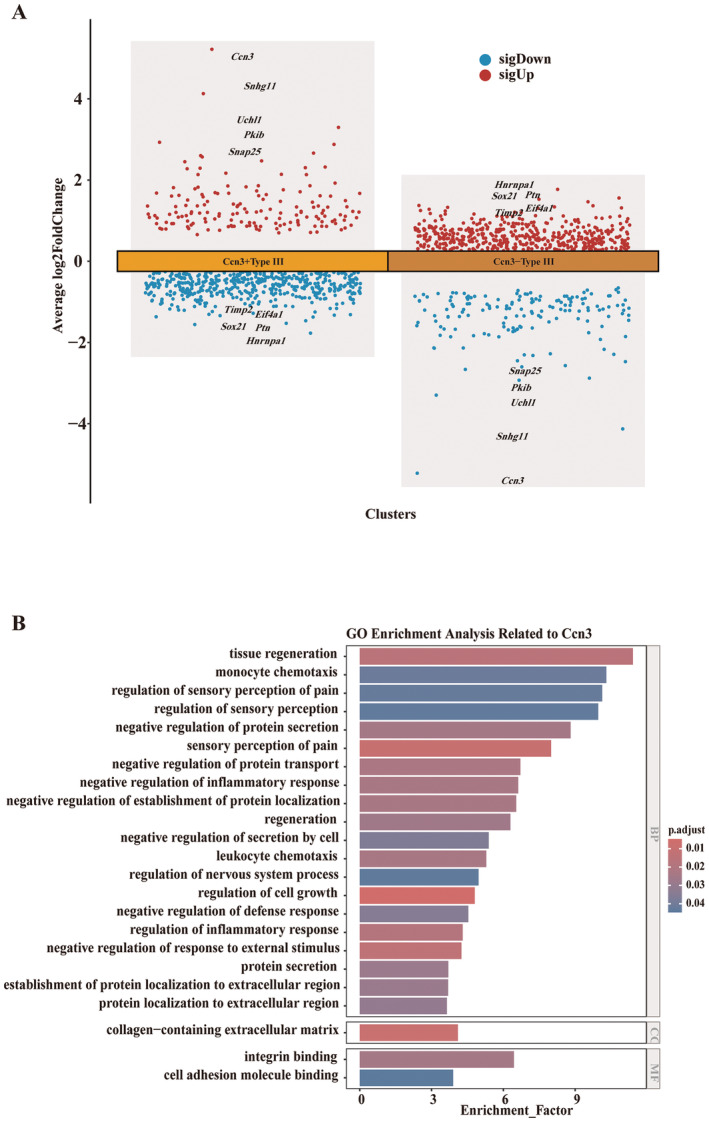
FIGURE 10.

Predicting the potential functions of Ccn3 in Type III cells. (A) Differentially expressed genes between Ccn3+Type III and Ccn3−Type III cell subgroups. (B) GO enrichment analysis displaying the pathways involving the Ccn3 gene in Type III taste cells. Row data from Vercauteren Drubbel and Beck (2023).
