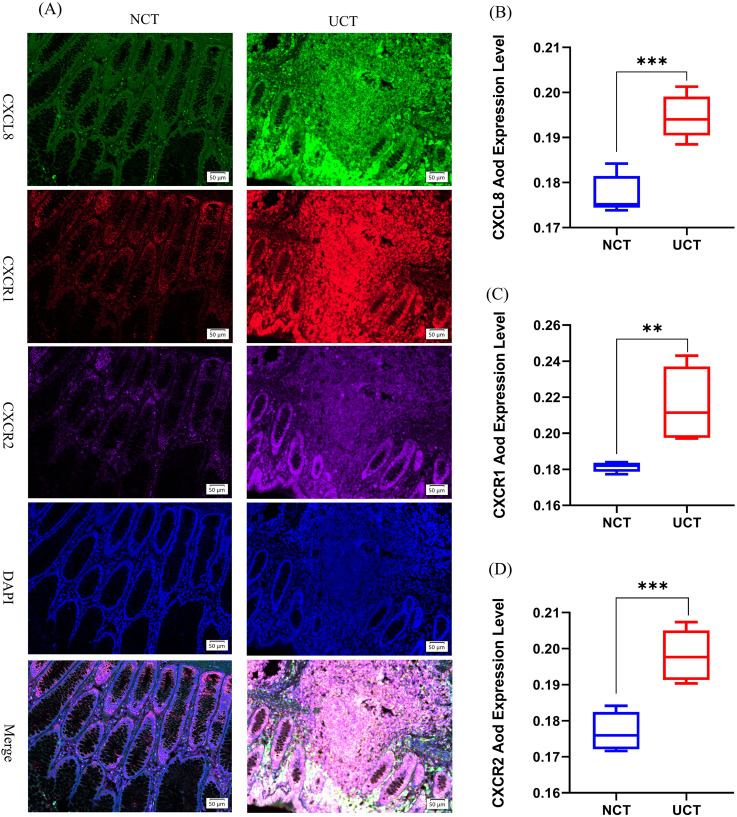
FIGURE 2.
Expression changes of CXCL8-CXCR1/2 in UC tissue versus normal colon tissue. (A) Multiplex fluorescent immunohistochemistry was used to measure CXCL8, CXCR1, and CXCR2 protein levels in normal colon tissue (NCT) and ulcerative colitis tissues (UCT). CXCL8 was labeled in green, CXCR1 was labeled in red, CXCR2 was labeled purple, and DAPI was used to label nuclei in blue (magnification ×200); (B–D) Changes in AOD (average optical density) protein expression levels of CXCL8-CXCR1/2 in different intestinal tissues (n = 5). *p < 0.05, **p < 0.01, ***p < 0.001 vs. NCT.

