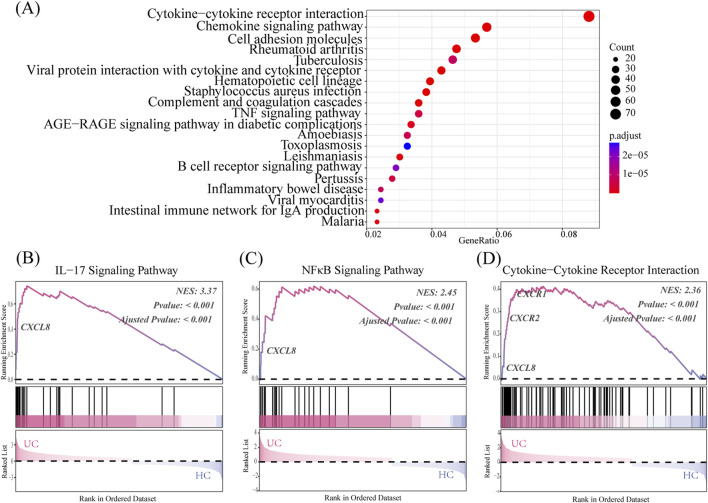
FIGURE 3.
CXCL8-CXCR1/2 gene expression in the transcriptome analysis. (A) KEGG pathway enrichment reveals the UC’s top 20 significantly enriched pathways group. (B–D) GSEA results compare the UC group to the HC group, using the Normalized Enrichment Score (NES) as a key metric. NES >0 indicates core genes on the left of the peak, while NES <0 indicates core genes on the right. Significance of the Enrichment Score (ES) is assessed using the p-value.

