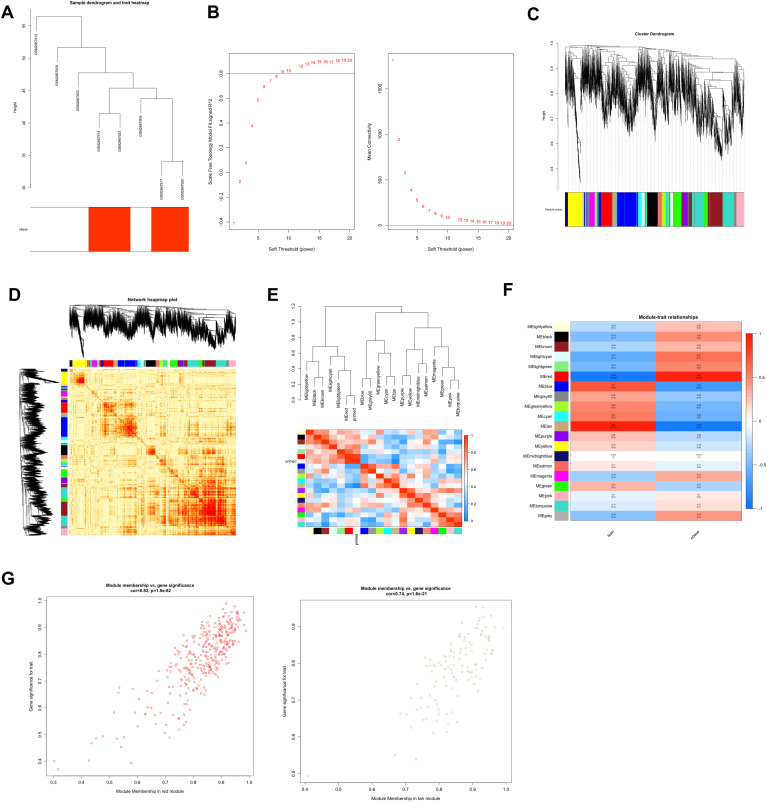
Figure 2.
Construction and module analysis of weighted gene coexpression network analysis (WGCNA). (A) Sample clustering dendrogram based on Euclidean distance. (B) Network topology analysis under various soft-threshold powers. Left: The x-axis represents the soft-threshold power. The y-axis represents the fit index of the scale-free topology model. Right: The x-axis represents the soft-threshold power. The y-axis reflects the average connectivity (degree). (C) Clustering dendrogram of genes with different similarities based on topological overlap and the assigned module color. (D) The heatmap depicts the topological overlap matrix (TOM) among all modules included in the analysis. The light color represents a low overlap, and the progressively darker red color represents an increasing overlap. (E) Eigengene dendrogram and eigengene adjacency plot. (F) Module–trait association. Each row corresponds to a module, and each column corresponds to a feature. Each cell contains the corresponding correlation and P value. This table is color-coded according to the relevance of the color legend. (G) Scatter plot showing correlations of gene significance for obese vs. module membership in the red and tan modules.

