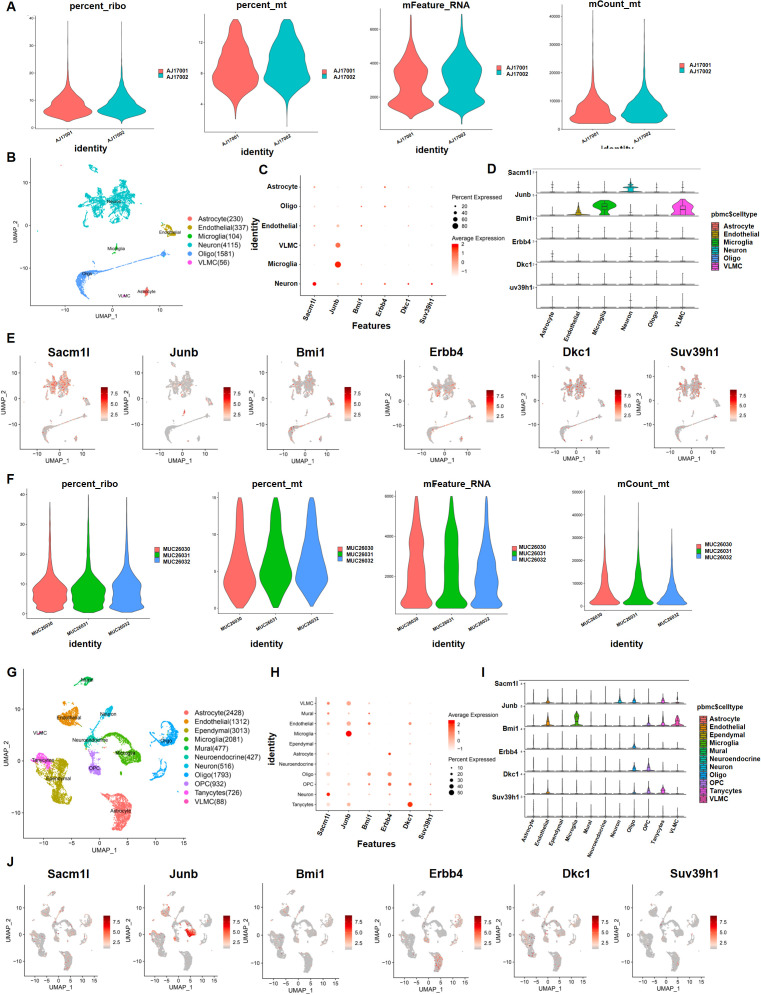
Figure 5.
Preprocessing of the single-cell sequencing data and cell cluster identification with GSE125065 and GSE205667. First, with GSE125065: (A, B, F, G) Gene filtering and PCA clustering of the gene expression matrix. (C, H) Dot plot showing the expression of overlapping genes in each main cell type. The darker color indicates higher expression, and the larger size represents a higher percentage of expression. (D, E, I, J) Expression pattern of six neuron stress-related genes at the single-cell level, shown in violin and UMAP plots.

