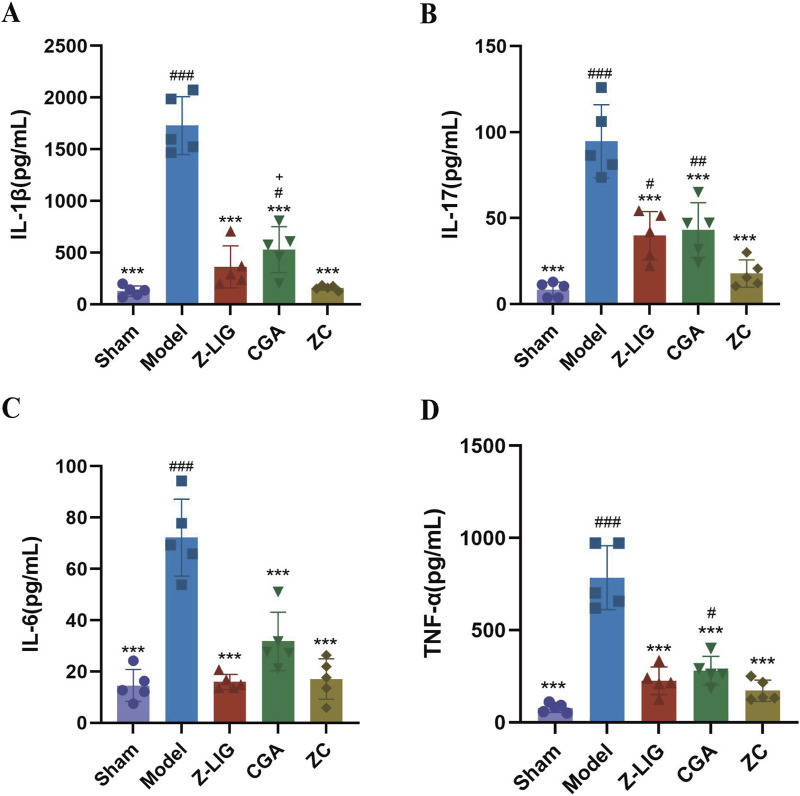
FIGURE 11.
Z-LIG/CGA inhibits the expression of proinflammatory cytokines in serum. (A) The IL-1β values of each group. (B) The IL-17 values of each group. (C) The IL-6 values of each group. (D) The TNF-α values of each group. Data are expressed as mean ± SD (n = 5). #P < 0.05, ##P < 0.01, ###P < 0.001 vs. Control group. *P < 0.05, **P < 0.01, ***P < 0.001 vs. Model group. +P < 0.05, ++P < 0.01, +++P < 0.001 vs. ZC group.

