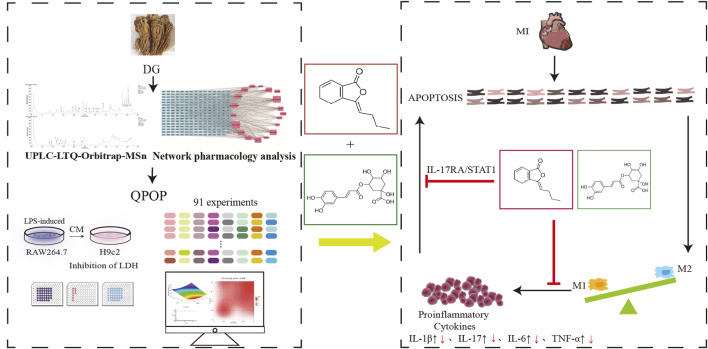
FIGURE 12.
The flowchart of our search strategy. The black upward arrow indicates an increase in proinflammatory signaling factors after MI, and the red downward arrow indicates a decrease in expression levels after Z-LIG/CGA treatment. Abbreviations: DG, Angelica sinensis (Oliv.) Diels; QPOP, quadratic phenotypic optimization platform; CM, conditioned medium; LDH, lactate dehydrogenase; MI, myocardial infarction.

