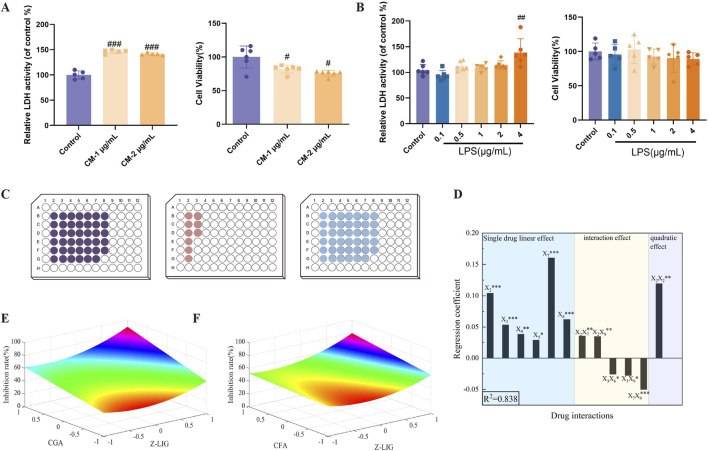
FIGURE 3.
Screening of combinations with cardiomyocyte-protective effects. (A) Establishment of the H9c2 cells inflammatory model. (CM-1 μg/mL: conditioned medium which was collected from the supernatants of RAW264.7 cells induced by 1 μg/mL LPS for 24 h. CM-2 μg/mL: conditioned medium which was collected from the supernatants of RAW264.7 cells induced by 2 μg/mL LPS for 24 h) (B) Direct effects of different concentrations of LPS on H9c2 cells. (C) Experimental design for three levels of the operational variable X 1. The 91 experiments were split and completed on three well plates as shown in the figure, corresponding from right to left to levels −1, 0, and 1. (D) The coefficient plots of the significance estimate at P< 0.05. (E, F) Response surface maps from the two-drug combinations with significant bilinear effects. (E) X 2 (Z-LIG) and X 7 (CGA); (F) X 2 (Z-LIG) and X 8 (CFA). Data are expressed as mean ± SD (n = 5–6). #P < 0.05, ##P < 0.01, ###P < 0.001 vs. Control group. Statistical analyses were done using sum of squares F-test.

