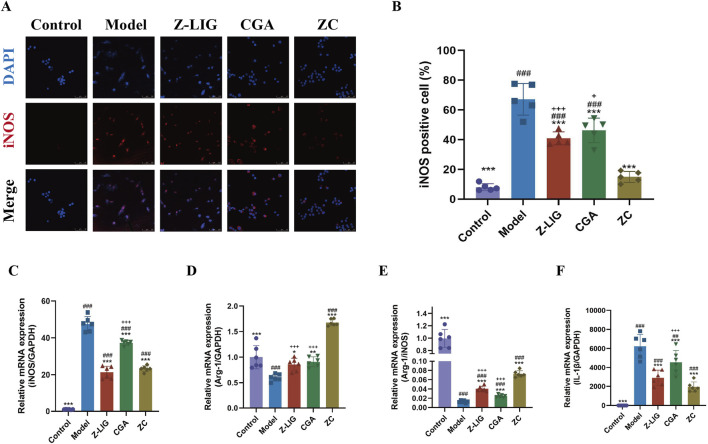
FIGURE 6.
Z-LIG/CGA inhibits LPS-induced M1 macrophage polarization and the expression of pro-inflammatory cytokines. (A, B) Representative photomicrographs and quantification of immunofluorescence staining of RAW264.7 cells. iNOS positive cells (red) and nuclei (blue) are indicated. (C) Relative mRNA expression of iNOS. (D) Relative mRNA expression of Arg-1. (E) The ratio of relative mRNA expression levels of iNOS and Arg-1. (F) Relative mRNA expression of IL-1β. Data are expressed as mean ± SD (n = 5). #P < 0.05, ##P < 0.01, ###P < 0.001 vs. Control group. * P< 0.05, **P < 0.01, ***P < 0.001 vs. Model group. +P < 0.05, ++P < 0.01, +++P < 0.001 vs. ZC group.

