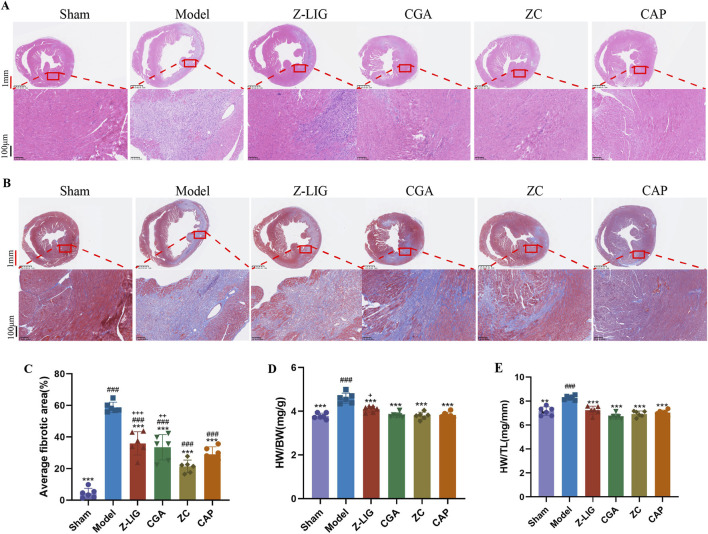
FIGURE 8.
Cardioprotective effects of Z-LIG/CGA 7 days post-MI. (A) Representative panoramic photographs of hearts with HE staining in each group. HE staining showed different levels of inflammatory cell infiltration in the infarction area. Red scale bar: 1 mm, black scale bar: 100 μm. (B) Representative panoramic photographs of hearts with Masson’s staining in each group. Scar tissue was stained blue, and viable cardiomyocyte was stained red. Red scale bar: 1 mm, black scale bar: 100 μm. (C) Quantifies the cardiac fibrotic area in each group. (D) The ratio of the heart weight-to-body weight (HW/BW) in each group. (E) The ratio of the heart weight-to-tibia length (HW/TL) in each group. Data are expressed as mean ± SD (n = 6). #P < 0.05, ##P < 0.01, ###P < 0.001 vs. Control group. *P < 0.05, **P < 0.01, ***P < 0.001 vs. Model group. +P < 0.05, ++P < 0.01, +++P < 0.001 vs. ZC group.

