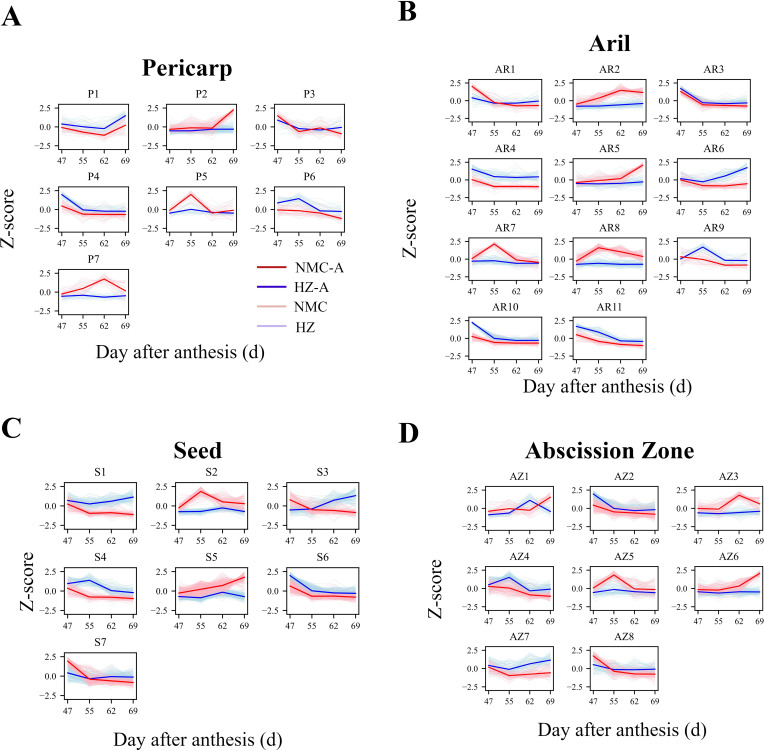
Figure 3.
k-means clustering of gene expression patterns in the pericarp (A), aril (B), seed (C) and AZ (D). Cluster analysis of DEGs in “Huaizhi” and “Nuomici” based on Z-score normalized method. The light red dotted and light blue dotted represent the expression profiles of “Nuomici” (NMC) and “Huaizhi” (HZ) in each cluster, respectively. The red and blue solid line represent the average profile of “Nuomici” (NMC-A) and “Huaizhi” (HZ-A) in each cluster, respectively.

