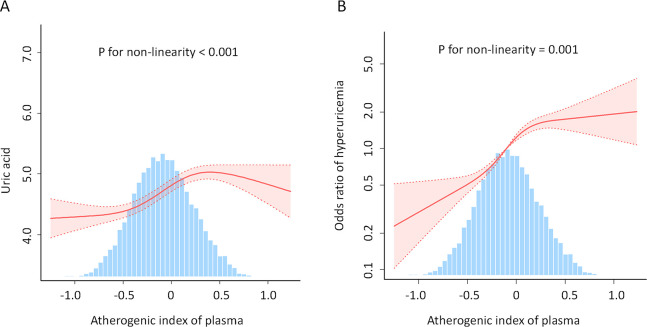
Figure 3.
Association between AIP and uric acid levels (A) and hyperuricemia (B). An L-shaped, non-linear relationship was observed between AIP and both uric acid levels and the prevalence of hyperuricemia (P < 0.05). The solid line depicts the estimated values, while the dashed line represents the corresponding 95% confidence interval. The inflection points were 0.588 (A) and 0.573 (B). Adjustment factors included age, sex, race, family poverty income ratio, BMI, waist circumference, education level, alcohol consumption status, smoking status, marital status, diabetes, hypertension, serum creatinine, coronary heart disease, heart failure, stroke, sedentary time, low-density lipoprotein-cholesterol, total cholesterol; glycohemoglobin, urine albumin/urine creatinine, urinary creatinine, and urinary albumin. AIP, atherogenic index of plasma; BMI, body mass index.

