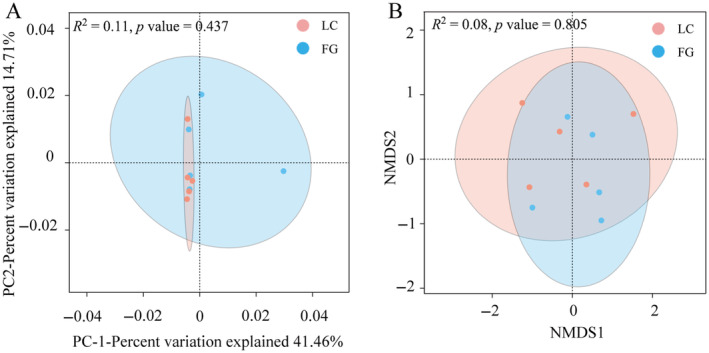
FIGURE 3.

Beta diversity analysis of gut microbiota from T. roborowskii according to PCA analysis and NMDS analysis. (A) PCA analysis of the gut microbiota in LC and FG groups based on Bray‐Curtis distance, the discrete distribution of samples along the PC1 and PC2 axes. (B) NMDS analysis of the gut microbiota in LC and FG groups based on Binary‐Jaccard distance.
