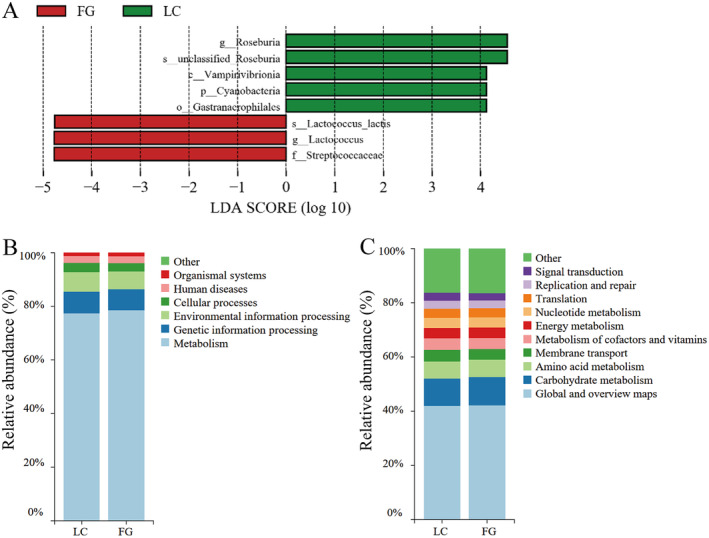
FIGURE 5.

LEfSe and KEGG pathways analysis of gut microbiota in LC and FG groups. (A) LEfSe analysis of gut microbiota composition in LC and FG groups of T. roborowskii (LDA > 4, p < 0.05). The highlighted taxa were significantly enriched in the group that corresponds to each color. The letters “p”, “c”, “o”, “f”, “g,” and “s” indicate phylum, class, order, family, genus, and species, respectively. Histogram of KEGG functional composition of gut microbes in T. roborowskii in LC and FG group at the top level (B) and second level (C).
