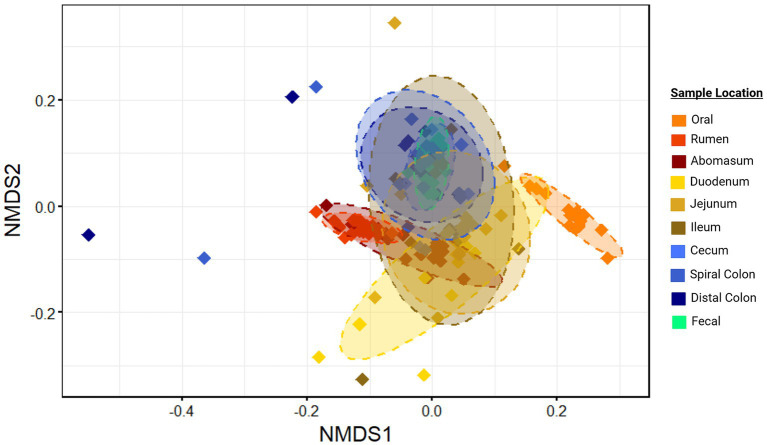
Figure 2.
Ordination of community structure by sample location. Non-metric multidirectional scaling (NMDS) of generalized Unifrac distances illustrate differences in microbial community structure between sample sites. Ellipses represent the 95% confidence intervals for the group mean values. Plots were created in R, and legends were added using BioRender.com.

