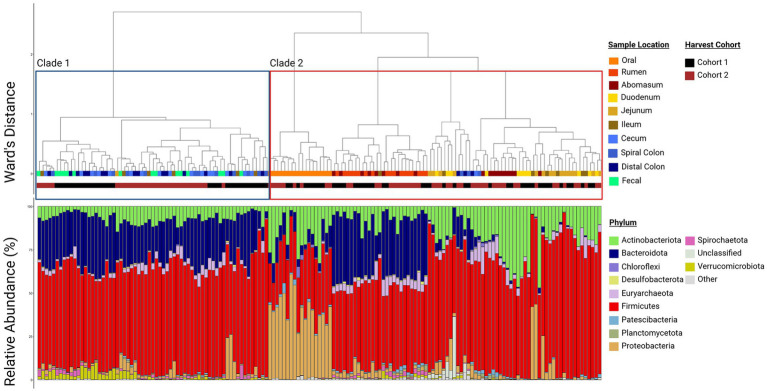
Figure 3.
Paired dendrogram and relative abundance plot by sample location. Clustering of similar sample sites reinforces that samples from similar locations have similar community structures and the relative abundance plot shows which phyla compose those communities. Each box in the relative abundance plot is an individual sample and corresponds to the dendrogram above denoting what type of sample is being represented. Plots were created in R, and legends were added using BioRender.com.

