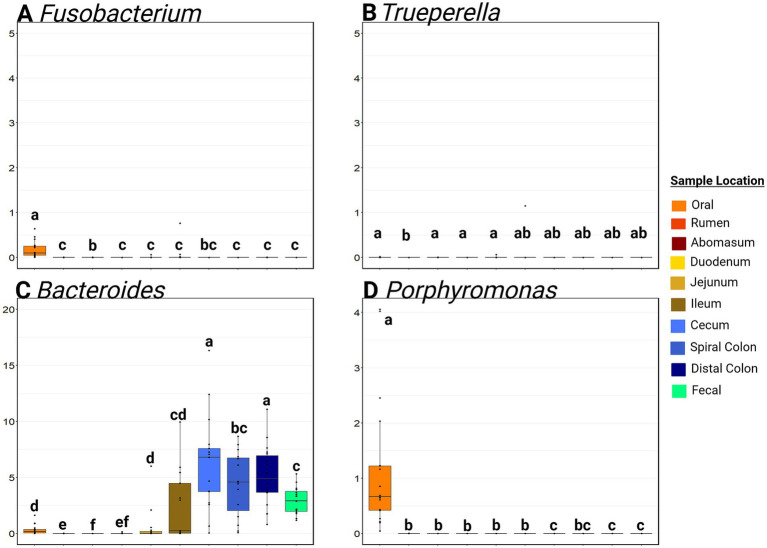
Figure 6.
Boxplots of the relative abundance along the gastrointestinal tract of genera associated with liver abscesses. Panel (A) represents the relative abundance of Fusobacterium at various sites. Panel (B) represents the relative abundance of Truperella at various sites. Panel (C) represents the relative abundance of Bacteroides at various sites. Panel (D) represents the relative abundance of Porphyromonas at various sites. Within a plot, boxes with different superscripts (abcdef) differ by a pairwise Wilcoxon rank sum test (p ≤ 0.05). Plots were created in R, and legends were added using BioRender.com.

