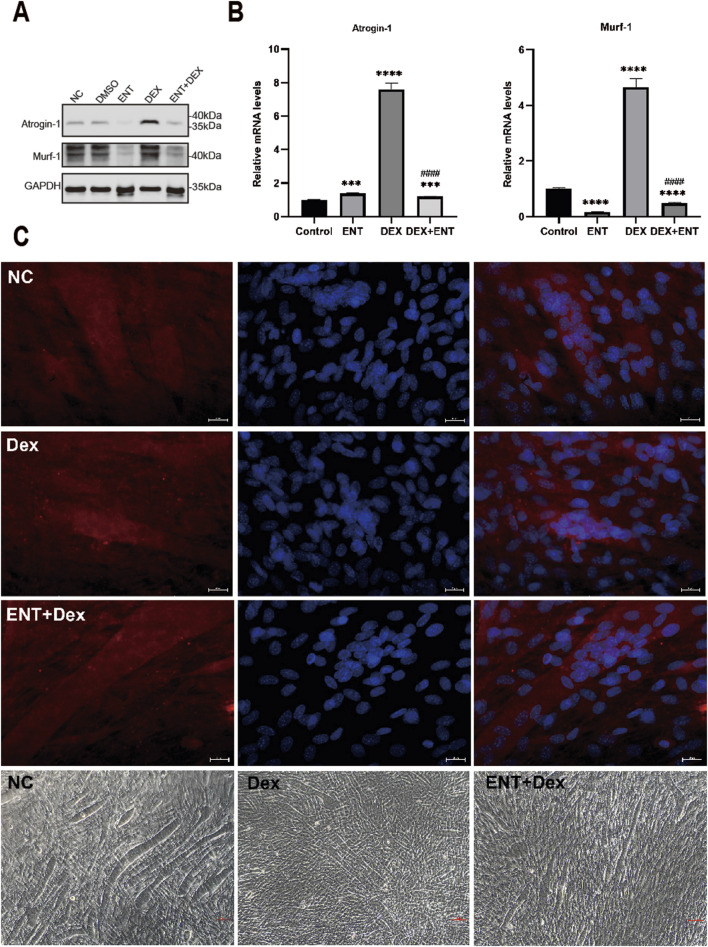
FIGURE 2.
Representative pictures of C2C12 myotubes treated with DMSO or 50 µM Dex, 100 µM ENT. (A) Protein levels of Atrogin-1 and Murf-1 in C2C12 myotubes treated with 50 μM Dex and 100 μM ENT, with GAPDH serving as a loading control. (B) qRT-PCR analysis of Atrogin-1 and Murf-1 in C2C12 myotubes treated with 50 μM Dex and 100 μM ENT. (C) Immunofluorescence staining and phase-contrast microscope images of C2C12 myotubes revealed that Dex induced muscle atrophy, as evidenced by a reduction in myotube diameter, while ENT mitigated Dex-induced muscle atrophy in C2C12 myotubes. Each experiment was conducted with a sample size of n = 4 per group. NC represents the control group, Dex refers to dexamethasone, ENT + Dex indicates entacapone + dexamethasone. The scale bar represents 25 μm.

