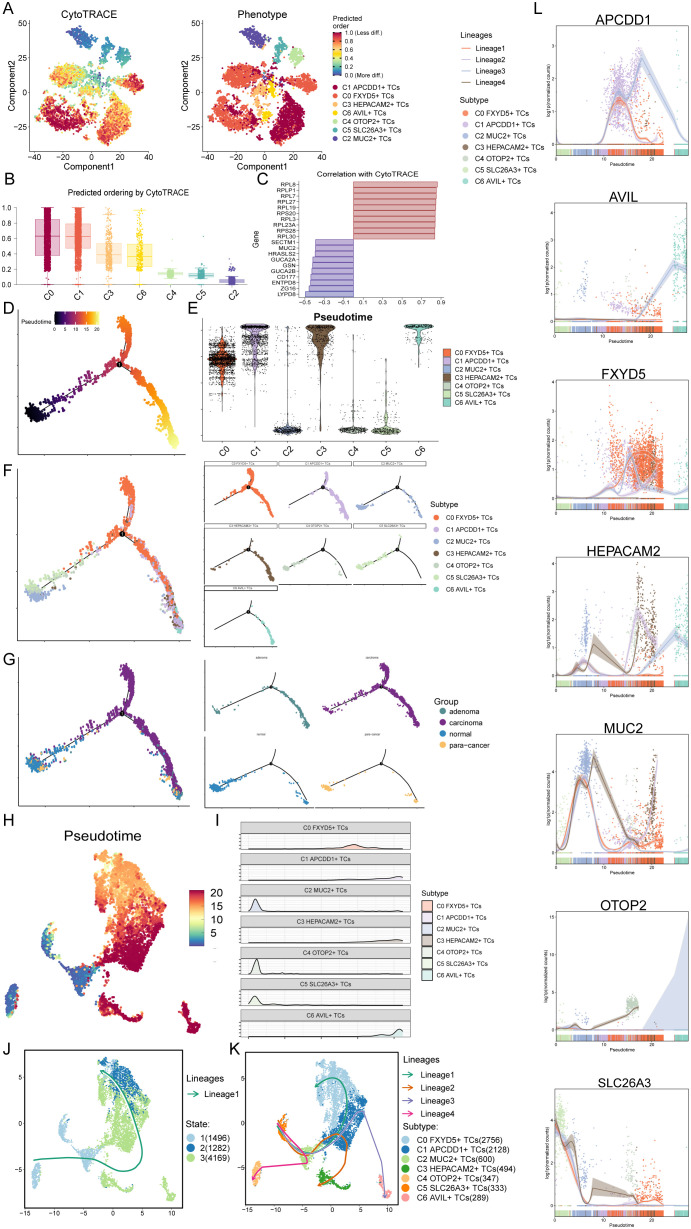
Figure 4.
CytoTRACE and SlingShot analyses demonstrated the developmental trajectories of different subtypes of TCs. (A) The left panel demonstrated the distribution of TCs CytoTRACE scores. The color represented high or low cell stemness. The right panel indicated the distribution of TCs subtypes. The color represented different TCs subtypes. (B) Box line plot ranked the stemness of TCs subtypes according to CytoTRACE. (C) The bar graph showed the correlation of different genes with CytoTRACE, where higher than 0 indicates a positive correlation and less than 0 indicates a negative correlation. (D) Pseudotemporal trajectory plot demonstrated monocle-predicted differentiation trajectories of TCs. The distribution of pseudotime order by Monocle were shown. (E) Violin plots demonstrated the pseudotime distribution and density of different subtypes of TCs. (F, G) The pseudotime distribution of subtypes (F) and tissue sources (G) of TCs by Monocle were shown respectively. (H) Demonstration of the distribution of slingshot-predicted TCs differentiation trajectories among all TCs by UMAP plot. Plotting each spectrum according to the pseudotime value to infer the result, the color from blue to red indicates the pseudotime from naïve to mature. (I) Ridgeline plots demonstrated the pseudotime distribution and density of different subtypes of TCs. (J) The distribution of differentiation trajectory of 3 states fitted by the pseudotime order in all tumor cells. (K) The distribution of four differentiation trajectories of 7 TCs subtypes fitted by the pseudotime order in all tumor cells. (L) Dynamic trend plots demonstrated the trajectories of named genes of 7 cell subtypes of tumor cells changing on four lineages obtained after slingshot visualization.

