Figure 6.
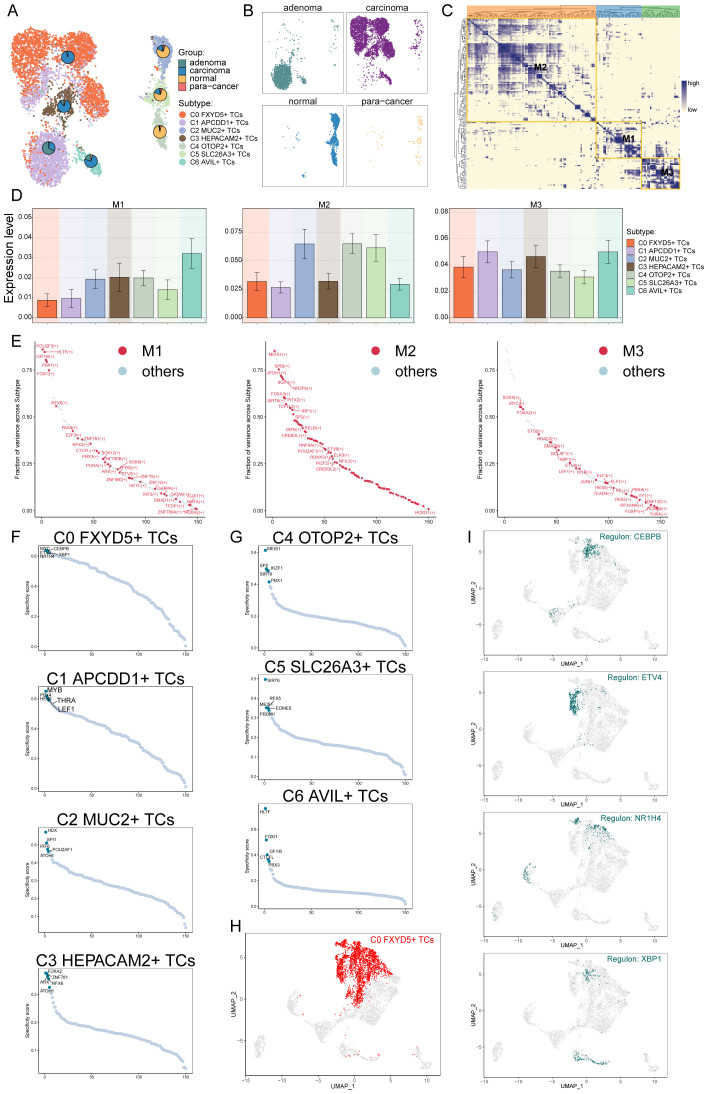
Identification of tumor cells Gene Regulatory Network. (A, B) UMAP plot visualization of all TCs based on regulator activity. Colored according to cell subtype. Pie charts showed the proportion of different tissue sources in TCs subtypes. (C) Based on the CSI matrix, three regulatory modules of TCs subtypes were identified. (D) Bar graphs illustrated the expression levels of different regulatory modules in subtypes of TCs. (E) In subtypes, the ranking of regulators in different regulation modules based on fraction of variance. (F, G) Rank for regulons in different TCs subtypes based on regulon specificity score (RSS). (H) C0 FXYD5+ TCs were highlighted in the UMAP plot (red). (I) Expression of key regulators CEBPB, ETV4, NR1H4 and XBP1 of C0 FXYD5+ TCs in all TCs.

