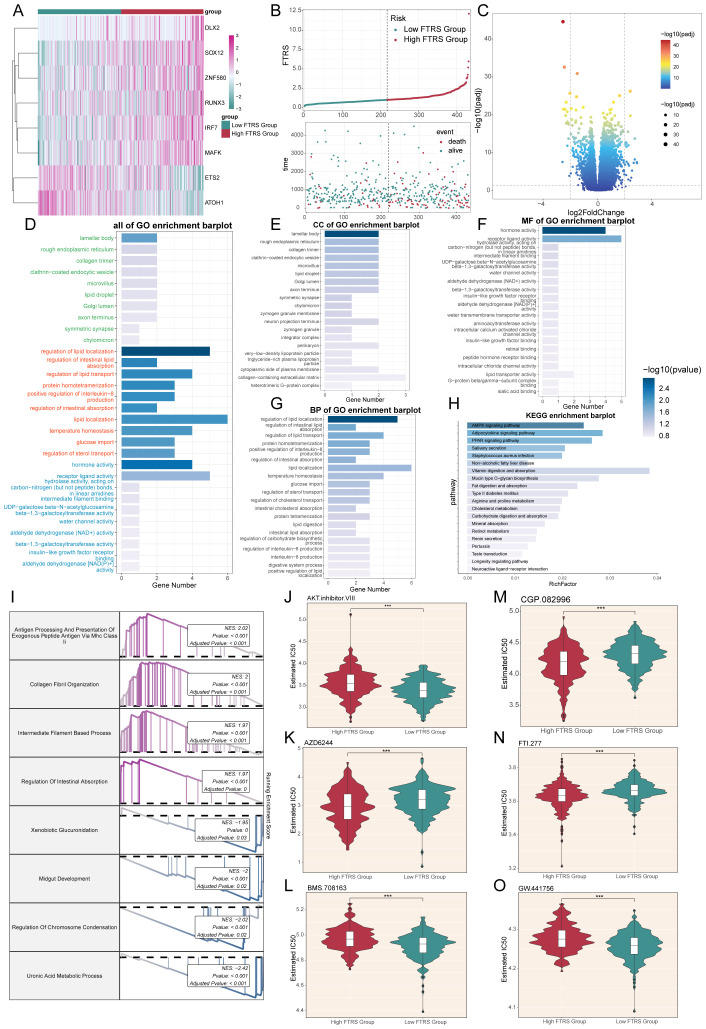
Figure 9.
Enrichment analysis and drug sensitivity analysis in different risk groups. (A) Heatmap displayed differential expression of model genes, with color scale based on normalized data. (B) Curve chart illustrated the risk scores of high and low FTRS groups, and scatter plot depicted survival/death events over time for both groups. (C) Volcano plot showed significantly differentially expressed genes. Each spot represents a gene. (D-H) Bar charts separately presented the enrichment analysis results of differential genes in all of GO, GO-CC, GO-MF, GO-BP and KEGG pathways for high and low FTRS groups. (I) Results of GSEA of differentially expressed genes. (J-O) Violin plots demonstrated the sensitivity of tumor cells in the high and low FTRS risk groups to different drugs. *** represents P ≤ 0.001.

