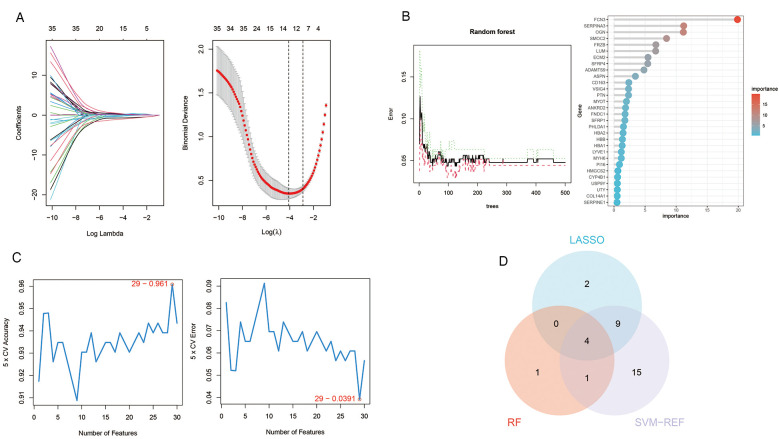
Figure 6.
Machine learning in screening candidate diagnostic biomarkers for pre-decompensation stage of HF. (A) In the Lasso model for biomarker screening, we plotted LASSO coefficient profiles of the selected genes, determining the optimal lambda at the point where the model's error was minimal. Each line in the left graph represents a gene, while the right graph's vertical lines indicate the model's error, pinpointing the best gene selection count at 15. (B) In the RF model, we focused on the relative importance of the candidate genes, specifically highlighting the top six genes as determined by the random forest's importance calculation. (C) The SVM-RFE model's screening involved utilizing the algorithm to identify the most accurate genes, demonstrated by the plot where the number of genes selected is balanced against their predictive accuracy. Based on the highest accuracy and lowest error obtained from the curves, we selected the top 29 genes as candidate genes. (D) A Venn diagram consolidates the outcomes, indicating four genes consistently identified across the three analytical methods.

