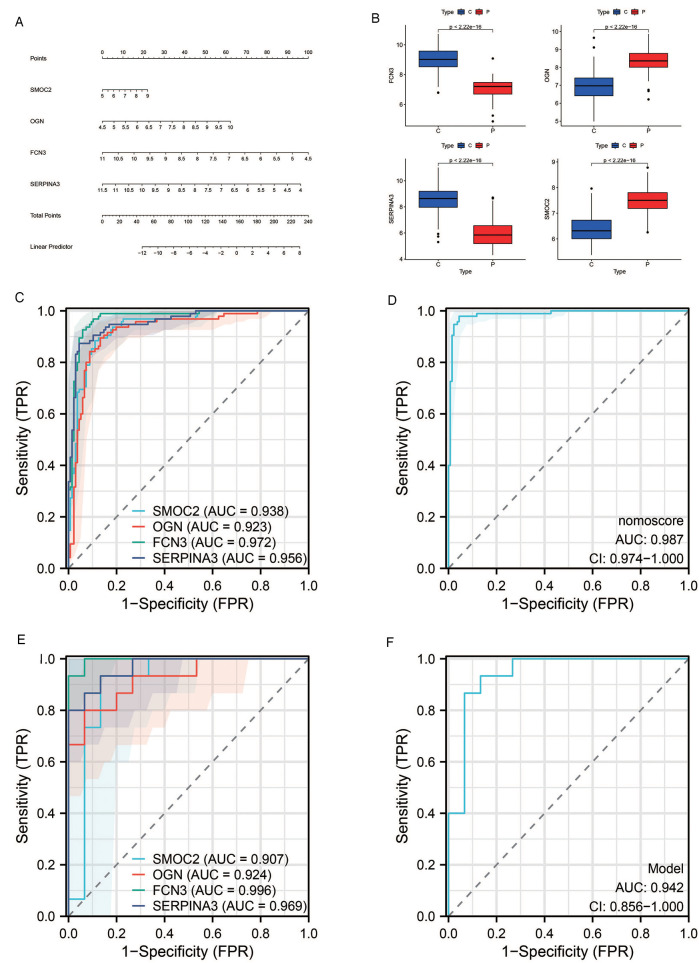
Figure 7.
Results of diagnostic value assessment. (A) The illustrative nomogram for diagnosing pre-decompensation stage of HF. (B) Differential expression of hub genes in HF patients relative to normal controls in dataset GSE57338. (C) The ROC curve for individual candidate genes within the GSE57338 dataset. (D) The ROC curve for the nomogram highlighting their diagnostic value for pre-decompensation stage of HF. (E) The ROC curves for each candidate gene within the GSE16499 dataset. (F) The ROC curve representing the diagnostic efficacy of the 4-gene model in dataset GSE16499.

