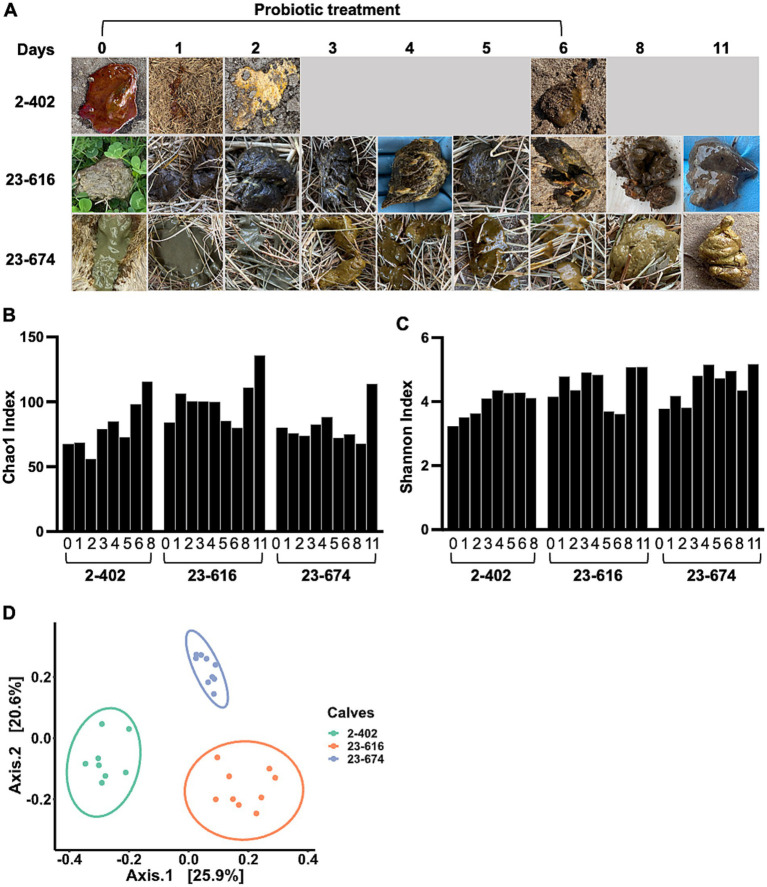
Figure 4.
Impact of probiotic treatment on gut microbiota diversity and individual responses in calves. (A) The timeline of probiotic treatment and the corresponding sample collection points. Accompanying photographs illustrate the changes in fecal morphology observed in diarrheic calves throughout the course of probiotic treatment (Day 1 – 6). Fecal morphology was recorded on Day 0 prior to probiotic treatment. (B,C) An increase in gut microbiota richness and evenness during the treatment period. The Chao1 index (B), highlighting species richness, and the Shannon index (C), reflecting both species abundance and evenness, indicate the development of more diverse and abundant microbial communities in three calves undergoing probiotic treatment. (D) The beta-diversity among probiotic-treated calves, analyzed using the Unweighted-Unifrac dissimilarity matrix. The data reveal distinct, individualized microbiome structures among the three calves, underscoring the personalized microbial response to probiotic intervention.

