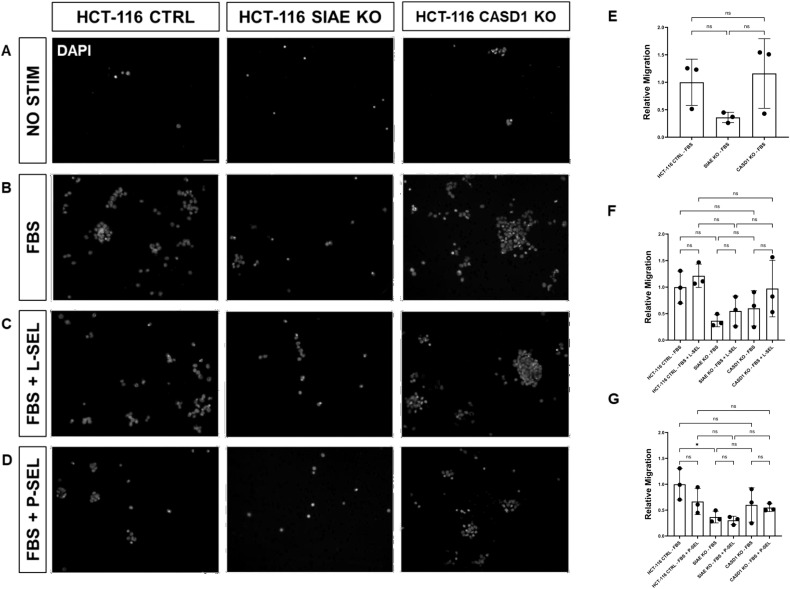
Figure 10.
SIAE Facilitates Cell Migration in HCT-116 Cells. (A-D) Epifluorescent micrographs of transwell membranes with DAPI labeled nuclei in HCT-116 Ctrl, SIAE KO, and CASD1 KO cell lines. HCT-116 colon cancer cells were seeded on a PET membrane and stimulated with 0.2% FBS-DMEM (A), 10% FBS-DMEM (B), L-Selectins supplemented 10% FBS- DMEM (C), or P-Selectins supplemented 10% FBSDMEM (D). After 24hrs, migratory cells on the membranes’ bottom surface were fixed in methanol and mounted in media containing DAPI. Membranes were imaged via epifluorescent microscopy, and migratory cell nuclei were quantified. (E-G) Cell migration of SIAE and CASD1 knockout cell lines stimulated with FBS (E), L-Selectins and FBS (F) or P-Selectins and FBS (G) is graphed relative to HCT-116 Ctrl migration when stimulated with 10% FBS-DMEM. Scale bar = 100µm. Quantifications show one of three biological replicates, each including three membranes per stimulus for each cell line. * p<0.05 ns = not significant (p>0.05) indicating significance. Error bars represent the standard deviation of triplicate samples.

