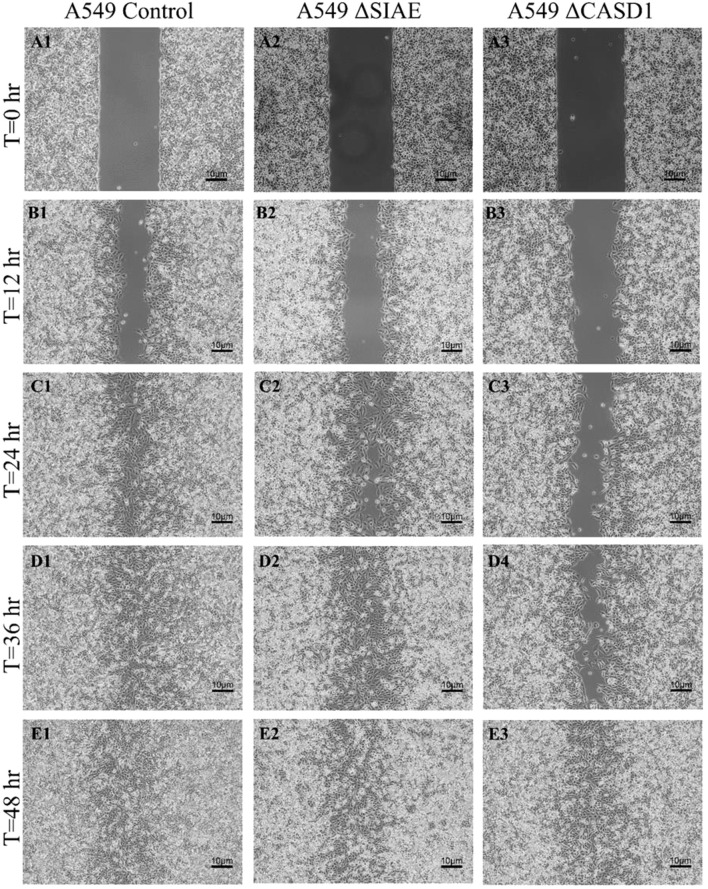
Figure 12.
Scratch Migration Assay in A549 Cells. A549 control (left), A549 ΔSIAE (middle) and A549 ΔCASD1 (right) cells were plated in a 6-well plate IBIDI insert with a 500 µm divider. The divider was carefully removed 12 hours after plating to create a uniform scratch. Cell migration into the scratch area was monitored by imaging every 12 hours over a period of 48 hours. Quantitative analysis of cell migration is presented in Figure 14 .

