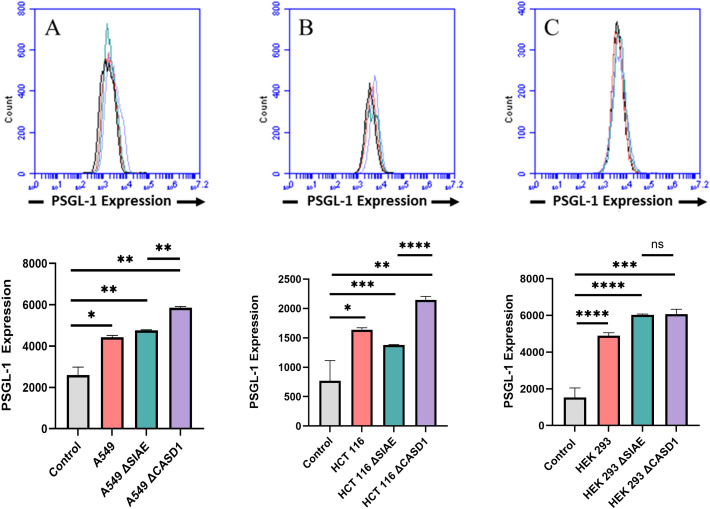
Figure 2.
Expression Levels of P-Selectin Glycoprotein Ligand-1 (PSGL-1) on the Surface of Lung, Colon, and Control Lines. PSGL-1 expression was assessed in A549 lung cancer cells (A), HCT 116 colon cancer cells (B), and HEK 293 non-cancerous kidney cells (C), along with their respective knockouts. Cells were plated in a 96-well V-bottom plate and treated with Tru-Stain blocking buffer for 30 minutes. Subsequently, cells were incubated with commercially available PSGL-1-FITC for 2 hours at 4°C in the dark. Data were collected via flow cytometry. For statistical analysis was conducted using Two-way ANOVA to analyze the data of these experiments for comparison using GraphPad Prism 8. Data, as seen below, is always presented as mean ± standard deviation with P < 0.05 indicating significance. Error bars represent the standard deviation of triplicate samples. * p<0.05, ** p<0.005, *** p<0.001, ****p<0.0001, ns = not significant (p>0.05).

