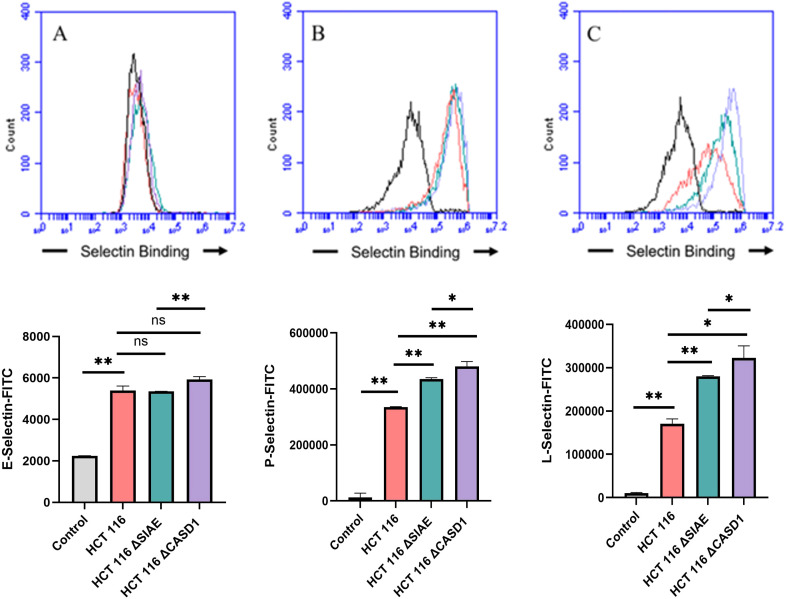
Figure 6.
Selectin Binding Assay on Colon Cancer. Binding interactions between E-Selectins (A), P-Selectins (B), and L-Selectins (C) with their respective ligands were quantified using flow cytometry. HCT116 cells were seeded at a density of 2x10^5 cells per well in a 96-well V-bottom plate and incubated with different Selectins-FITC conjugates at 4°C for one hour. For statistical analysis was conducted using Two-way ANOVA to analyze the data of these experiments for comparison using GraphPad Prism 8. Data, as seen below, is always presented as mean ± standard deviation with P < 0.05 indicating significance. Error bars represent the standard deviation of triplicate samples. * p<0.05, ** p<0.005, *** p<0.001, ns, not significant (p>0.05).

