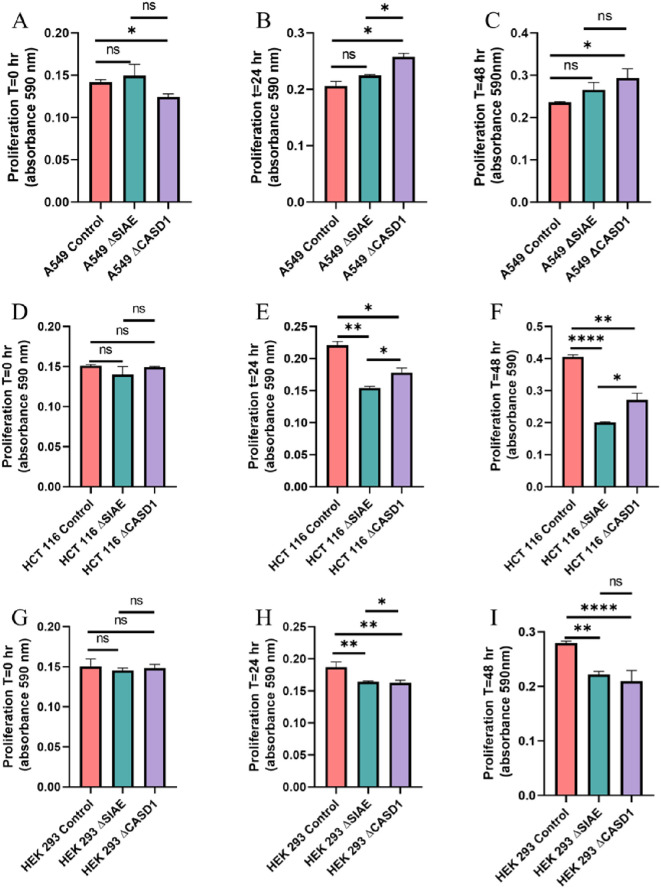
Figure 8.
Proliferation Assay. A549 cells (A-C), HCT 116 cells (D-F), and HEK 293 cells (G-I) were plated at a density of 50,000 cells per well in separate 12-well plates containing media supplemented with 10% FBS. Cells were incubated for 0 hours (left), 24 hours (middle), and 48 hours (right). At each time point, 50 μl of MTT reagent and 50 μl of media were added to each well. After a 2-hour incubation at 37°C in the dark, 150 μl of neutralizing solvent was added, followed by rocking for 15 minutes. Absorbance was measured at 590 nm to assess cell proliferation, with increased absorbance indicating higher metabolite levels. Data were acquired using flow cytometry. For statistical analysis was conducted using Two-way ANOVA to analyze the data of these experiments for comparison using GraphPad Prism 8. Data, as seen below, is always presented as mean ± standard deviation with P < 0.05 indicating significance. Error bars represent the standard deviation of triplicate samples. * p<0.05, ** p<0.005, ****p<0.0001, ns = not significant (p>0.05).

