Figure 8.
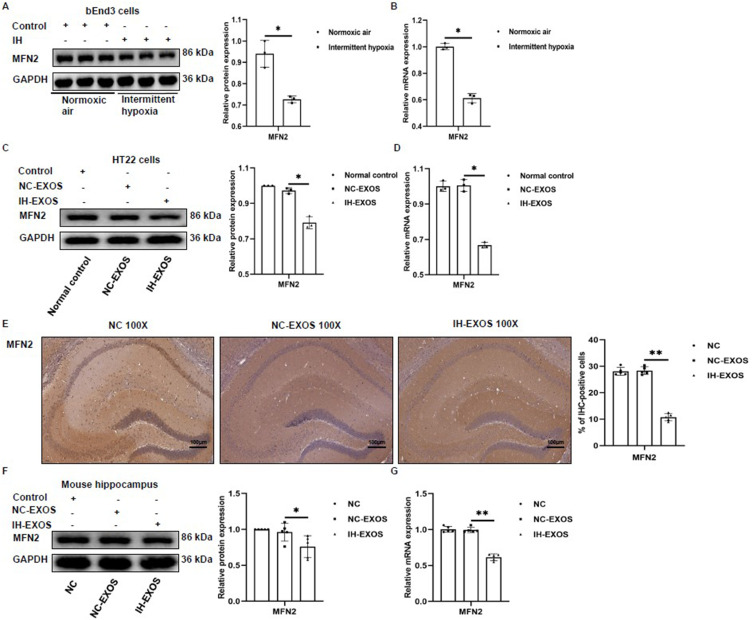
The expression of MFN2 was impaired (n=3). (A and B) The expression of MFN2 protein and mRNA in bEnd3 cells was detected by Western blot and qRT-PCR. (C and D) The expression of MFN2 protein and mRNA in HT22 cells was detected by Western blot and qRT-PCR. (E) The hippocampus was subjected to anti-MFN2 immunohistochemical staining. Magnification×100, the scale is 100 µm. (F and G) The expression of MFN2 protein and mRNA in the hippocampus was detected by Western blot and qRT-PCR. Statistical analysis of the data was performed using Student’s t-test (A and B, df=4), one-way ANOVA [C and D, df (2, 6); E-G, df (2, 12)] followed by Bonferroni’s multiple comparison tests. *P<0.05. **P<0.01.
Abbreviation: IHC, immunohistochemistry.

