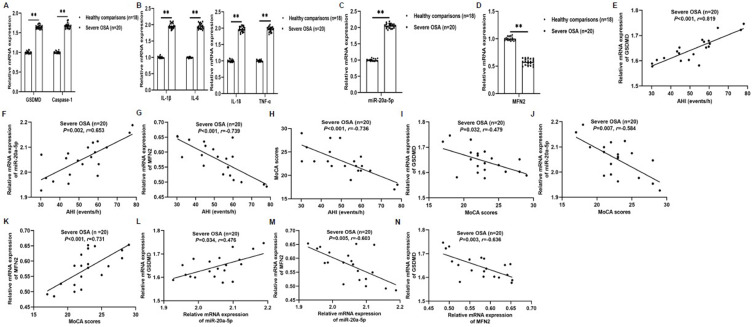
Figure 9.
Correlation between the levels of miR-20a-5p, GSDMD, MFN2 and clinical features in patients with severe OSA (n=20). (A–D) The expression of GSDMD, Caspase-1, IL-1β, IL-6, IL-18, TNF-α, miR-20a-5p, and MFN2 mRNA in peripheral blood was detected by qRT-PCR. (E–H) The correlation between clinical AHI and GSDMD (E), miR-20a-5p (F), MFN2 (G), and MoCA (H). (I–K) The correlation between clinical MoCA and GSDMD (I), miR-20a-5p (J), and MFN2 (K). (L and M) The correlation between miR-20a-5p and GSDMD (L) and MFN2 (M). (N) The correlation between MFN2 and GSDMD. Statistical analysis of the data was performed using Student’s t-test, df=36. Correlations were determined by Spearman’s rank correlation test. **P<0.01. P<0.05 was considered statistically significant.
Abbreviations: AHI, apnea-hypopnea index; MoCA, Montreal Cognitive Assessment.

