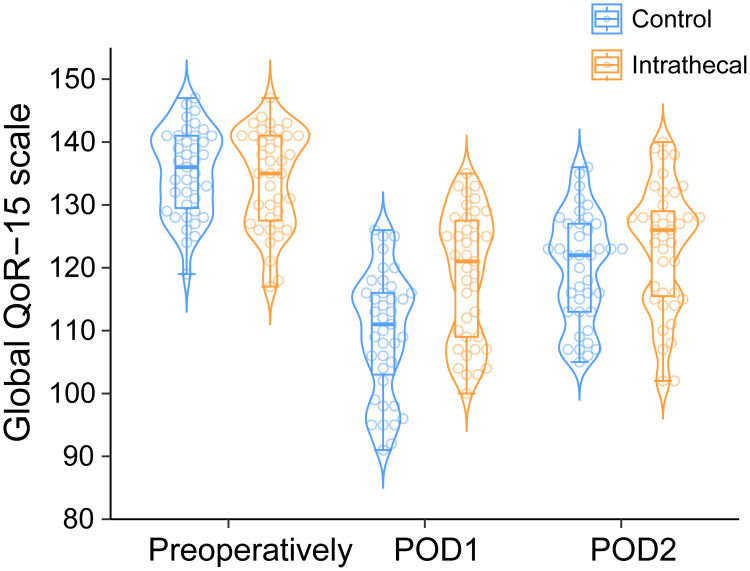
Figure 2.
Quality of Recovery-15 (QoR-15) score distribution over time.
Notes: Beeswarm-violin plots display QoR-15 scores for control (blue) and intrathecal (orange) groups at pre-operative, 24 h, and 48 h post-surgery timepoints. Individual data points appear as circles. Each plot features median values (horizontal line), interquartile ranges (box), and distribution boundaries (whiskers, 1.5 times IQR). The intrathecal group showed significantly higher scores at 24 h post-surgery (121 [109−128] vs 111 [102−116], p < 0.001), with this difference diminishing at 48 h (126 [115−130] vs 122 [113−127], p = 0.092).
Abbreviations: QoR-15, Quality of Recovery-15; IQR, Interquartile Range.

