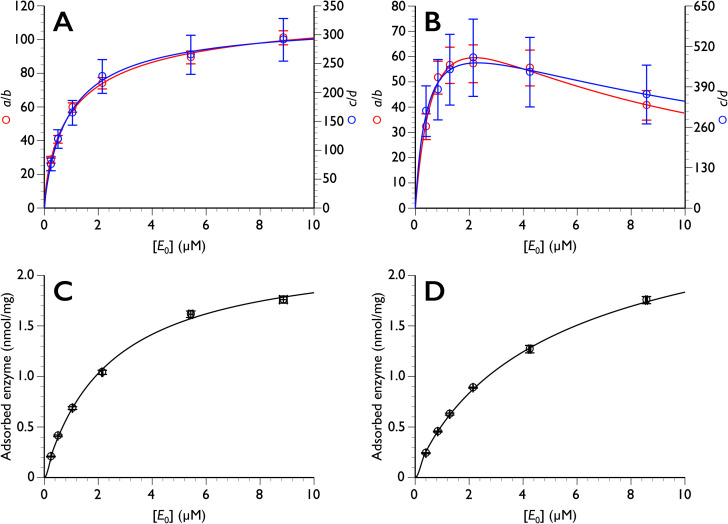
Fig. 3. The enzyme concentration dependence of both a/b and c/d.
Top: enzyme concentration (E0) dependence of a/b and c/d for PcCel6A (A) and TrCel7A (B). Bottom: amount of adsorbed enzyme plotted versus E0 for PcCel6A (C) and TrCel7A (D). The data in A, C, and D were fitted to typical hyperbolic curve (y = (a×x) / (b+x) where a and b are constants) while inhibition is considered (y = (a×x) /{b+x+(x2/c)} where a, b and c are constants) in B. Note that the E0 dependence of adsorption (C and D) does not correspond to a typical Langmuir plot of ES versus adsorbed enzyme.

