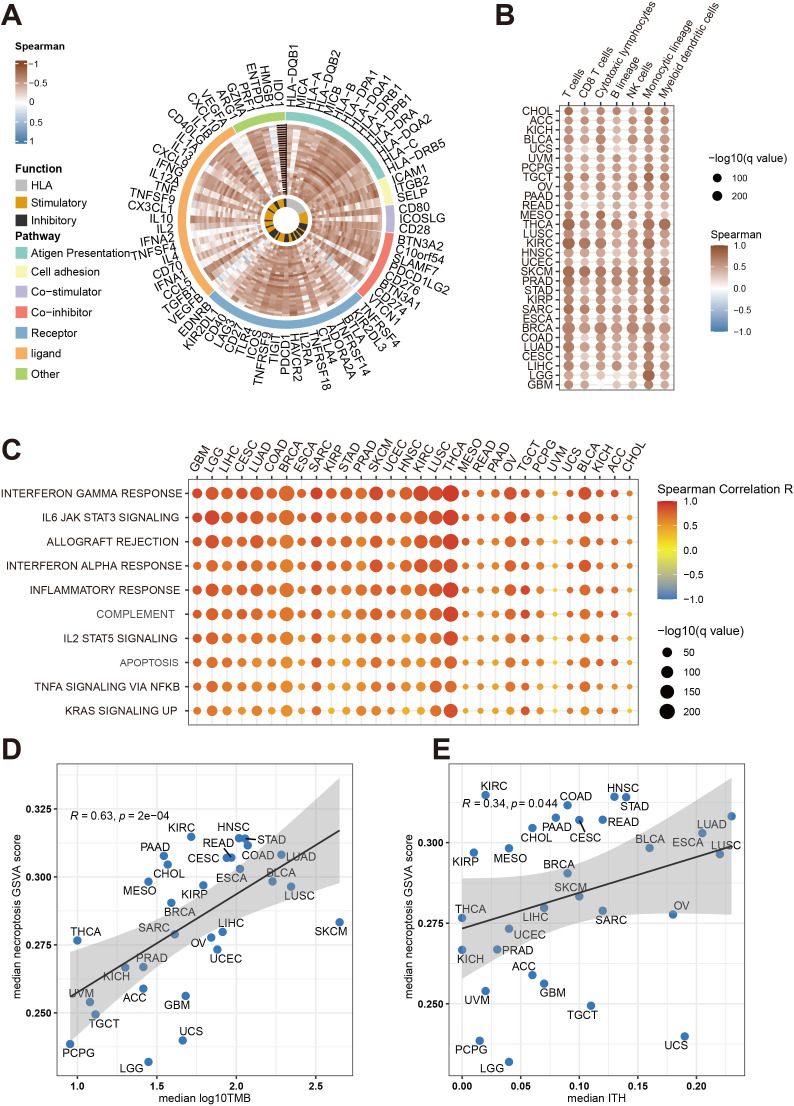
Figure 1.
Comprehensive analysis of necroptosis associations with immune infiltration and tumor traits across cancers in the TCGA cohort. (A) The Circos plot illustrates the relationship between necroptosis pathway activity (measured by GSVA scores) and immune gene expression across multiple cancer types. The color gradient reflects Spearman correlation values, ranging from -1 to 1. Gene functions are categorized as antigen presentation, HLA, stimulatory, inhibitory, and other immune-related functions. (B) This heatmap shows how necroptosis pathway activity correlates with immune cell infiltration (e.g., T cells, B cells, macrophages) in different cancers. Dot size indicates statistical significance (-log10(q value)), while color represents the Spearman correlation coefficient. (C) A bubble heatmap demonstrates the association between necroptosis pathway activity and key immune-related pathways, such as interferon gamma response, IL6 JAK STAT3 signaling, and inflammatory response, across cancer types. Dot size reflects statistical significance (-log10(q value)), and color represents the correlation strength (Spearman R). (D) Scatter plot depicting the correlation between median necroptosis pathway activity scores and median tumor mutational burden (TMB) across cancer types. Each point corresponds to a different cancer type, with the shaded area representing the confidence interval of the regression line. (E) Scatter plot showing the association between median necroptosis pathway activity scores and median intratumor heterogeneity (ITH) for various cancers. Similar to panel D, the Spearman correlation coefficient (R) and p-values are indicated in both plots.

