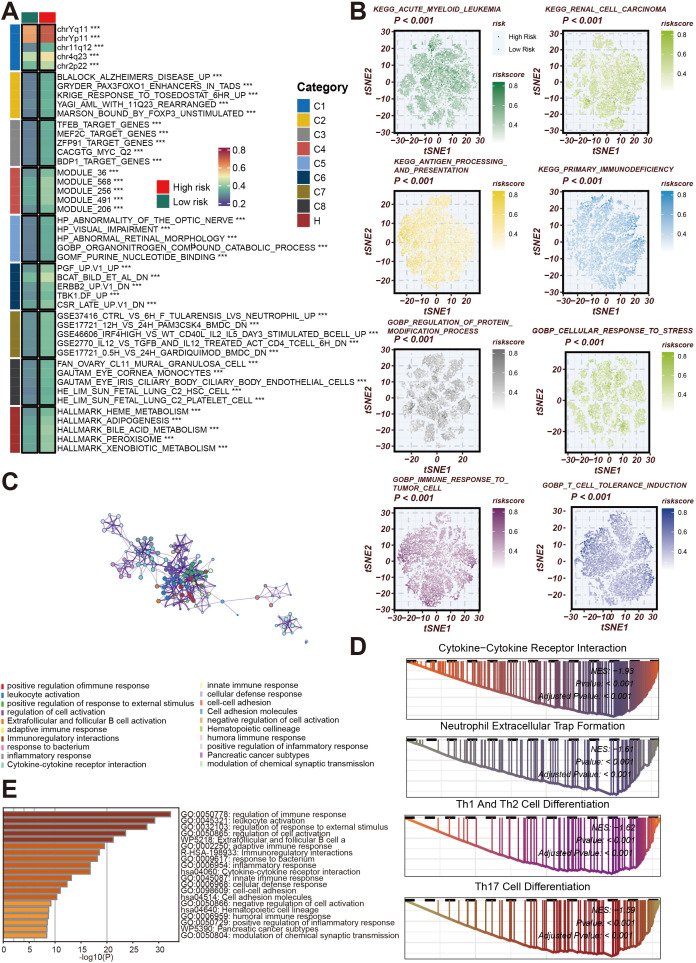
Figure 4.
Functional and Pathway Analysis of Necroptosis Gene Signature in Cancer. (A) Heatmap illustrating associations between gene sets and necroptosis risk across various cancer cohorts. Gene modules are classified into functional groups (C1 to C8), with risk categories annotated as high or low based on necroptosis risk scores. The gene sets highlighted include those related to cell cycle, metabolic processes, and immune regulation. (B) t-SNE plots showing the distribution of necroptosis risk scores in different cancer types, including acute myeloid leukemia, renal cell carcinoma, and antigen processing pathways. The risk scores are color-coded from low (green) to high (red), indicating the association between necroptosis and key biological pathways such as protein modification and stress response. (C) Network diagram depicting interactions between gene modules involved in cell cycle regulation and chromosome segregation. These gene modules highlight the complex interactions between pathways associated with tumor progression and necroptosis. (D) Bar graph showing the top enriched Gene Ontology (GO) terms related to immune response, cell activation, and inflammatory processes. The length of the bars corresponds to the significance level of enrichment (-log10(P)) for each GO term. (E) Gene Set Enrichment Analysis (GSEA) plots for key enriched pathways, including cytokine-cytokine receptor interaction, neutrophil extracellular trap formation, and Th1/Th2/Th17 cell differentiation. The plots show enrichment scores and p-values, emphasizing the involvement of necroptosis in immune cell activation and differentiation pathways.

