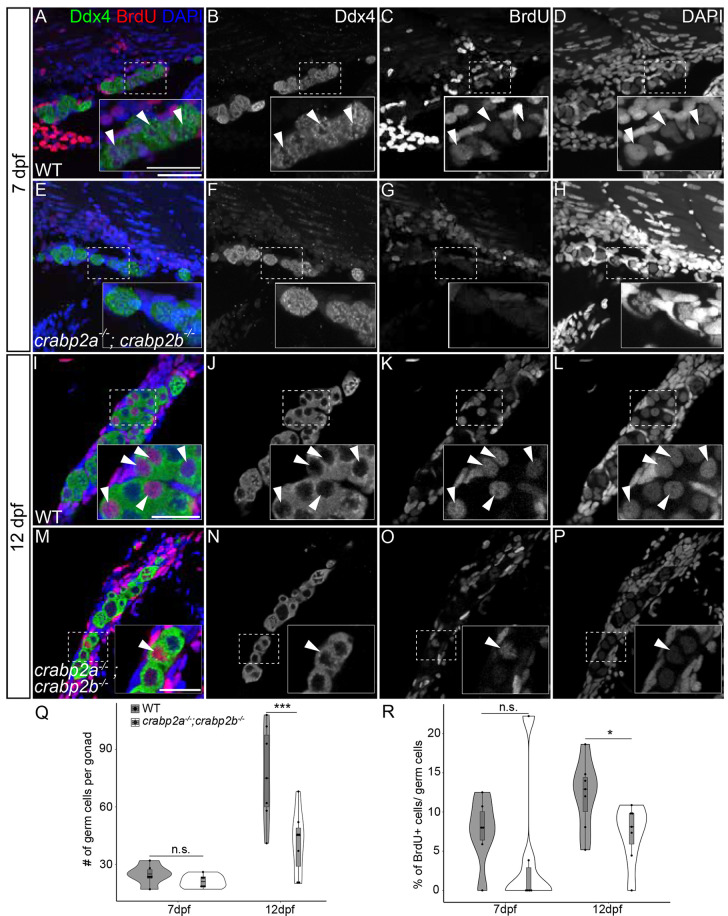
Fig. 3.
Crabp2 mutant gonads have fewer germ cells and decreased germ cell proliferation. (A-P) Representative confocal z-projections of BrdU incorporation at 7 (A-H) and 12 (I-P) dpf in gonads of wild type and crabp2a−/−; crabp2b−/− double mutants. (A,E,I,M) Anti-Ddx4 antibody-labeled germ cells (GCs) are green; BrdU-labeled proliferating cell nuclei are red; DAPI-labeled nuclei are blue. (B,F,J,N) Grayscale Ddx4; (C,G,K,O) BrdU; (D,H,L,P) DAPI. Insets show magnified views of regions of interest in GCs (outlined). Arrowheads indicate GC nuclei showing BrdU incorporation. (Q) Violin, and box and whisker plots depicting GC numbers at 7 and 12 dpf. Each datapoint represents total GC number per gonad. At 7 dpf, crabp2a−/−; crabp2b−/− double mutants and wild types are similar (P=0.1775). At 12 dpf, crabp2a−/−; crabp2b−/− double mutants have significantly fewer GCs than wild types (P=0.0001). (R) Violin, and box and whisker plots depicting the percentages of proliferating GCs at 7 and 12 dpf. Each datapoint represents the number of BrdU+ GCs per gonad. At 7 dpf, crabp2a−/−; crabp2b−/− double mutants and wild types are similar (P=0.4507). At 12 dpf, crabp2a−/−; crabp2b−/− double mutants have significantly fewer BrdU+ GCs compared to wild types (P=0.0424). An unpaired two-tailed t-test was used to test for significance (*P<0.05; ***P<0.0001; n.s., no significance). Violin plots: wild type, gray bars; crabp2a−/−; crabp2b−/− double mutants, white bars. The box represents the interquartile range (IQR) where 50% of the data points are present. The height of the box is inversely proportional to the clustering of the measurements. Outliers are present outside the box and quartiles. The horizontal line in the box plot represents the median. Scale bars: 50 μm (25 μm in insets). Wild type: 7 dpf, n=3 larvae; 12 dpf, n=7 fish. crabp2a−/−; crabp2b−/−mutants: 7 dpf, n=3 larvae; 12 dpf, n=8 fish.

