
FIGURE 9.
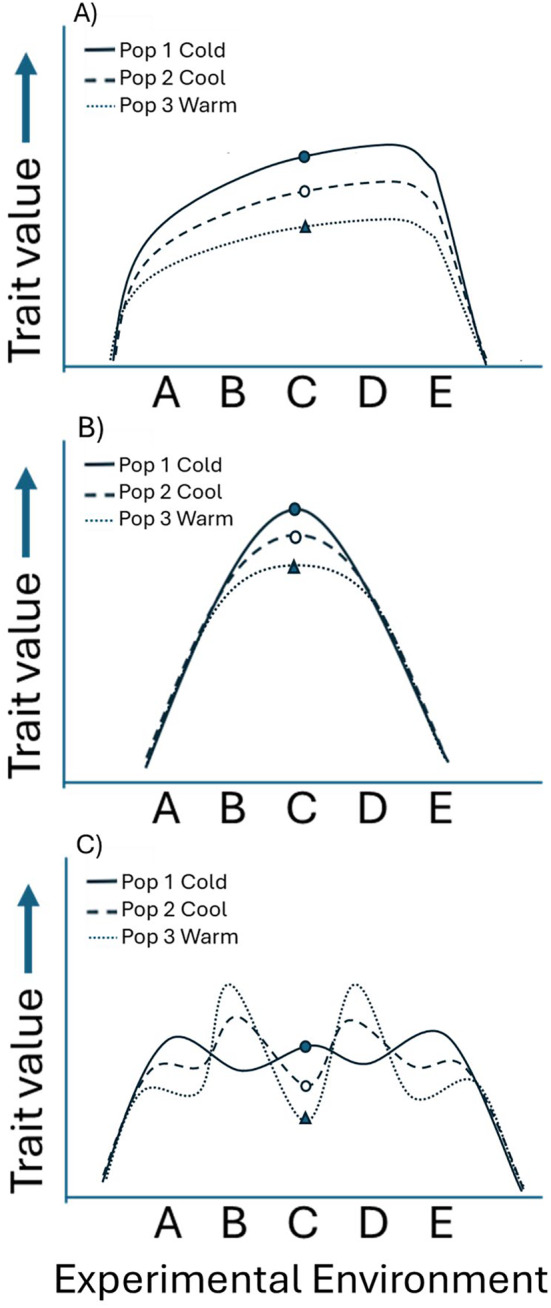
Hypothetical models of potential reaction norms of three populations (pop 1, pop 2, and pop 3) along an environmental gradient. Model A depicts how differences in a phenotypic response may be found across experimental environments when exhibiting “master of all environments.” Relationships such as these are considered to reflect countergradient variation when the phenotypic shifts among populations are compensatory and genetically influenced across the environmental gradient (Conover and Schultz 1995). Model B depicts how differences in a phenotypic response may be found in only one experimental environment. If the phenotype exhibited compensatory evolution in that environment, then countergradient variation would result along the environmental gradient. Model C depicts how trait values could be similar on average over multiple environments (however, unlikely) but result in phenotypic differences in singular environments. Across all models, if one environment was the most common in the wild and/or the preferred environment (e.g., experimental environment C) and the phenotypic shifts across populations exhibited compensatory evolution in that environment, then countergradient variation would result.