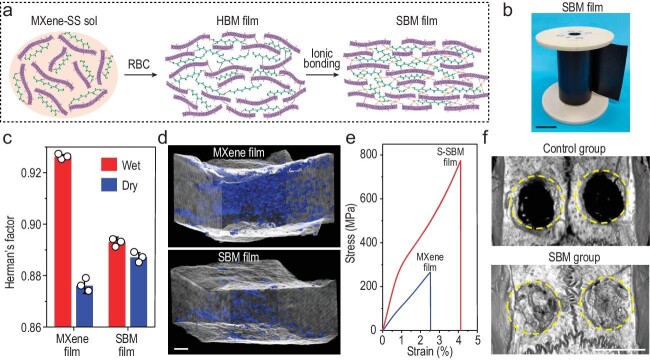
Figure 1.
(a) Schematic of the structural evolution in the production process of SBM films. (b) Photograph of a roll of SBM film. Scale bar, 10 cm. (c) Herman's orientation factor of wet and dry MXene and SBM films. (d) 3D void microstructure of MXene and SBM films reconstructed by using nanoscale X-ray computed tomography. Scale bar, 1 μm. (e) Typical tensile stress–strain curves of MXene and SBM films. (f) Micro-computed tomography images of rat calvarial defect areas after bone repair for 8 weeks in control and SBM groups. Scale bar, 5 mm. Reproduced from [11] with permission.

