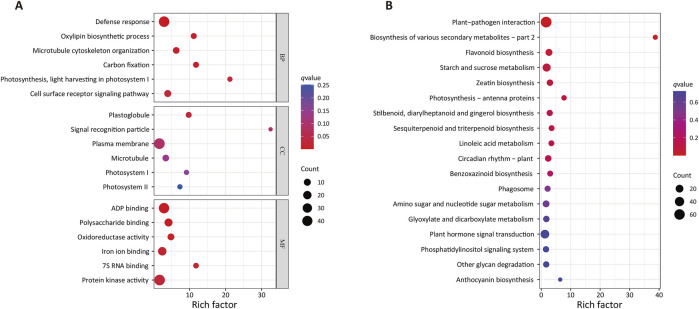
FIGURE 3.
GO and KEGG enrichment analyses of DEGs associated with drought tolerance. (A) GO enrichment. BP, biological process, CC, cellular component, MF, molecular function. (B) KEGG enrichment. Larger rich factor values are indicative of greater enrichment, while larger dot sizes are indicative of more genes, and redder coloration is indicative of more significant enrichment.

